Irrigated Areas - With Provinces
- Home
- »
- Search
- »
- Asia
- »
- Central Asia
- »
- Afghanistan
- »
Data Sets
Disclaimer: As of February 2017, be advised that all irrigated area maps have been updated based on a modified irrigated area model which takes province-level water availability, for a given year, into account.
Yearly Period
Afghanistan
Loading subregion products...
Download
Available Tools
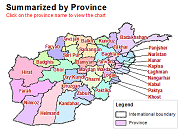
Afghanistan eMODIS NDVI irrigated areas (Province)
eMODIS NDVI irrigated area - Summarized by Province. Irrigated area maps identify the irrigated cropland across country annually. To map the irrigated areas consistently over time, a geospatial model was developed and driven by remotely sensed Normalized Difference Vegetation Index (NDVI) data. The near-real time smoothed 10-day NDVI composites with intervals every 5 days from the Moderate Resolution Imaging Spectroradiometer (MODIS) sensor, known as eMODIS, at 250m spatial resolution are used to create seasonal NDVI time series with peak NDVI identified. Seasonal peak values and time series were used in a threshold-dependent decision tree algorithm specific to dry and wet years and applied on pre-classified non-agricultural masked out lands to map irrigated areas. The maps were created as a means of distinguishing the spatial distribution and interannual variability in irrigated areas. Knowledge of such variability and its relation to production can be an important tool in monitoring food security condition.
Product Documentation
|
|
|
Background Irrigated area maps of Afghanistan identify the irrigated cropland across the country annually. The maps, produced through a hybrid method of classification and geospatial modeling, were created as a means of distinguishing the spatial distribution and interannual variability in irrigated areas. Knowledge of such variability and its relation to production can be an important tool in monitoring food security condition in Afghanistan. Data and Method To map the irrigated areas consistently over time, a geospatial model was developed and driven by remotely sensed Normalized Difference Vegetation Index (NDVI) data. The near-real time smoothed 10-day NDVI composites with intervals every 5 days from the Moderate Resolution Imaging Spectroradiometer (MODIS) sensor, known as eMODIS, and Visible Infrared Imaging Radiometer Suite (VIIRS) sensor are used to create seasonal NDVI time series with peak NDVI identified. Seasonal peak NDVI values and time series were used in a threshold-dependent decision tree algorithm, specific to dry and wet years, and applied to pre-classified non-agricultural masked out lands to map irrigated areas in Afghanistan. The irrigated area maps for the years from 2003 to 2021 were based on eMODIS NDVI, and the same for the years since 2022 were based on eVIIRS NDVI. As eVIIRS NDVI data are available since 2012, we will update the irrigated area model with eVIIRS NDVI for the historical years (2012-2021) at a later date. Although, the eMOIDS and eVIIRS NDVI differ in spatial resolution, the final derived irrigated area maps were produced at the same 250 m x 250 m spatial resolution for consistency. Validation In the absence of ground reference irrigated area information, the maps were evaluated with the irrigated areas classified from multiple snapshots of the landscape during the growing season from Landsat 5 optical and thermal sensor images. Irrigated areas were identified in Landsat images by selecting as irrigated, those areas with Landsat-derived NDVI greater than 0.30–0.45, depending on the date of the Landsat image and surface temperature less than or equal to 310 Kelvin (36.9 ° C). MODIS-derived irrigated area maps were compared with Landsat-derived irrigated area maps for four years: 2000, 2009, 2010, and 2011 over Helmand and Kandahar provinces in the southwest, Balkh and Jawzjan provinces in the north, Hirat province in the west, and Baghlan, Kunduz, and Takhar provinces in the northeast. The comparison yield goodness of fit r2=0.91 suggestive of good ability of identifying irrigated areas using this hybrid approach. In Afghanistan, a major portion of the country’s cereal production relies on irrigated agriculture. It has been observed that the annual cereal production tracks the variability of irrigated areas remarkably well (Figure 1), with a goodness of fit r2 = 0.9. The annual cereal production totals for 2001, 2004, and 2008 were among the lowest and corresponded to less irrigated area mapped for those same years. 
Figure 1. a) Irrigated area and cereal production for Afghanistan. Both irrigated area and cereal production time series have been normalized by their standard deviations. b) Goodness of fit between irrigated areas and cereal production for Afghanistan. Note: source of the cereal production data: 2001, MAIL, 2011; 2002–2012, MAIL, 2012, 2013, estimated in this study. Operational Mapping While there are multiple cropping seasons in Afghanistan, nearly 80% of the irrigated crops are grown during the first cropping season in Spring (Mar-May). Therefore, the irrigated area model gets implemented twice a year, first in May after the first irrigation season, and then in October after the end of the cropping seasons. Analysis shows the first season irrigated area statistics correlate better with the annual irrigated crop production. Therefore, the data and maps on this portal represent the irrigated area after the first cropping season. Typically, the irrigated area map and data for a new year get updated in early summer. Mapping Uncertainties The main source of uncertainty for the NDVI-derived irrigated area maps is the selection of NDVI thresholds to differentiate irrigated areas from non-irrigated area. The NDVI thresholds were selected empirically on a trial and error basis, and thus are somewhat subjective and may have uncertainty associated with them. Although the selected thresholds were effective in differentiating irrigated areas for the historical years, they need to be evaluated carefully with respect to environmental conditions, and adjustments in the NDVI threshold values may be necessary before applying the model for any future year. Permanent pasture/range land and forest were two of the key inputs to the non-irrigated area mask. These land cover types were identified using Spectral Angle Mapper, which is known to perform well in the areas of homogeneous land cover types. Although the pasture/range land and forest areas are concentrated in northern and northeastern Afghanistan, the classified maps of permanent pasture/range land and forest were not independently validated. The potential misclassification error in these land cover types may introduce positional uncertainties in the non-irrigated area mask used by the model. Although the 250-m resolution binary maps identified spatial distribution of irrigated areas across the county well, with the median irrigated farm size of 1.4 for Afghanistan, the fragmented small irrigated fields may not be well resolved in the NDVI-derived irrigated area maps. References MAIL (2011). Ministry of Agriculture, Irrigation and Livestock, Agriculture prospectus report. Kabul, Afghanistan. MAIL (2012). Ministry of Agriculture, Irrigation and Livestock, Agriculture prospectus report. Kabul, Afghanistan. How to Cite Pervez, M. S., Budde, M. and Rowland, J. (2014) Mapping irrigated areas in Afghanistan over the past decade using MODIS NDVI. Remote Sensing of Environment 149: 155-165. |