Moisture Index/Soil Water Index Anomaly
- Home
- »
- Search
- »
- Africa
- »
- Continental Africa
- »
Data Sets
Dekadal Period
Continental Africa
Loading subregion products...
Product Documentation
|
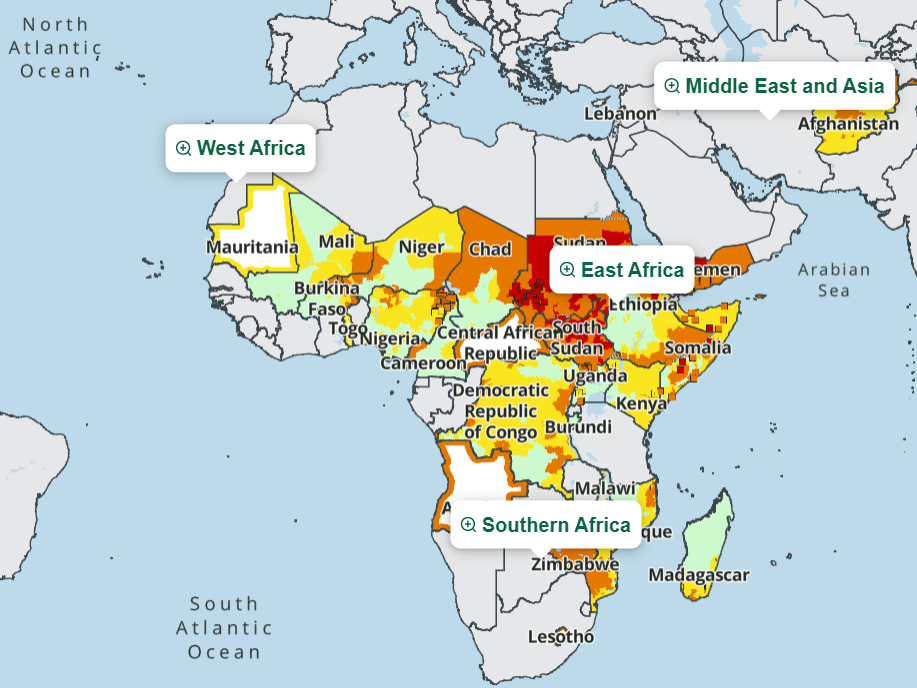
(updated August 19, 2002) This graphic contains 6 images. The upper left is the current dekad Moisture Index (MI) and the lower left is the current dekad Soil Water Index (SWI). The upper and lower center images are the differences between the current dekad and the immediately previous dekad for MI and SW respectively. The right side images are the differences between the current dekad and the long-term average for the same dekad for MI (upper) and SW (lower). NOTE: 1) The long-term average data for the MI and SW were calculated from 1961-1990 FAO rainfall and potential evapotranspiration data. 2) The MI differences are presented in units of percentage points difference. These are simple subtractions of one image from the other and are not to be confused with a ratio or percent difference calculations. 3) The Soil Water differences are in actual mm of soil water. The Soil Water Index is presented as a ratio (percent) of the soil's water holding capacity (WHC). |