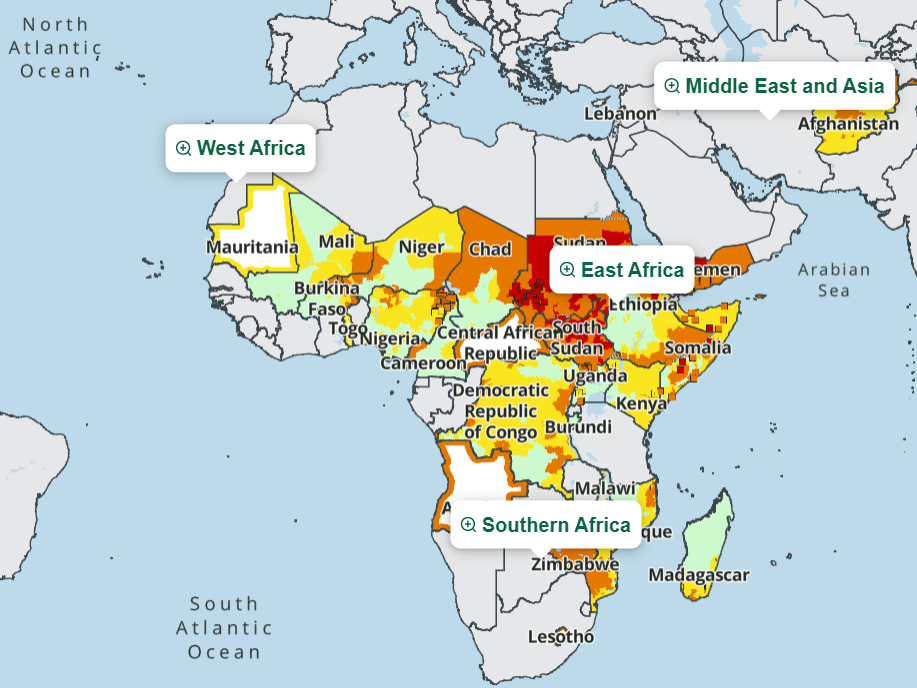
Daily Runoff and Anomaly
- Home
- »
- Search
- »
- Africa
- »
- Continental Africa
- »
Data Sets
Daily Period
Continental Africa
Loading subregion products...
Available Tools
The Early Warning eXplorer (EWX) software is an interactive web-based mapping tool that allows users to visualize continental-scale rainfall estimate (RFE), land surface temperature (LST) and normalized difference vegetation index (NDVI) data and anomalies at varied time steps and review time series analyses.
The Early Warning eXplorer (EWX) Lite software is an interactive web-based mapping tool that allows users to visualize time series of rainfall, NDVI, evapotranspiration, land surface temperature and snow water volume, where applicable. The EWX Lite allows users to access the same time series database that drives the standard EWX without having to load raster imagery which can inhibit performance in areas with poor internet connectivity.
Product Documentation
|
(updated: July 10, 2003) Daily runoff is generated using the Soil Conservation Service (SCS) Curve Number (CN) method. The model's primary input is the daily Rainfall Estimate (RFE), while its output is an estimate of the daily runoff in mm on a pixel-by-pixel basis for the entire continent of Africa. Surface runoff magnitude was determined using the SCS CN procedure (SCS, 1972). In this approach infiltration losses are combined with surface storage by the relationship shown in Equation 1. Q = (P - la)2/(P - la + S) .......................................(1) where Q is the accumulated runoff (rainfall excess) in mm (Q = 0, when P < Ia); P is rainfall in mm, Ia is the initial abstraction in mm that accounts for surface storage, interception, and infiltration prior to runoff defined by: la = 0.2 * S ..........................................................(2) and S is a parameter given by equation 3: S = 25400/CN - 254 .............................................(3) The magnitude of CN depends on soil hydraulic conductivity, land use and antecedent soil moisture conditions (AMC) at the start of the rainfall event. Africa-wide CN for an average antecedent soil moisture condition (type II AMC), derived by Artan et al. (2001), was used for this work. However, CN and S are adjusted based on 5-day AMC values during the daily simulations (Senay and Verdin, 2003). Daily runoff is calculated in ArcInfo GRID for each pixel with a spatial resolution of 10 km. The Daily Runoff Anomaly graphic shows the relative magnitude of a given day's runoff compared to a historical maximum. In order to avoid extreme runoff caused by erroneous rainfall estimates, the median of the maximum annual runoff (based on daily runoff values) from 1998 through the most recent year is used for the Daily Runoff Anomaly calculation. Daily Runoff Anomaly (%) = Daily Runoff/(median of annual maxima) * 100 Note that the daily runoff is being compared to the median of the annual maxima runoff values experienced during the period of historical data (1998 - present). Thus a magnitude close to 100% is equivalent to saying that today's runoff for a given pixel is close to the maximum observed value for that pixel during any day in the past (time series). References: Artan, G., J. Verdin, and K. Asante, 2001. A wide-area flood risk monitoring model, Fifth International Workshop on Application of Remote Sensing in Hydrology, UNESCO/IAHS, Montpellier, France, October 2-5. SCS, 1972. National Engineering Handbook, Section 4, Hydrology, SCS. Senay, G. B. and J. Verdin, 2003. Developing index maps of water-harvest potential in Africa. Annual International Meeting of ASAE, Las Vegas, NV, USA, July 27-30. |