Landscape Water Requirement Satisfaction Index (L-WRSI)
- Home
- »
- Search
- »
- Africa
- »
- Continental Africa
- »
Data Sets
Dekadal Period
Continental Africa
Loading subregion products...
Download
Product Documentation
Landscape Water Requirement Satisfaction Index (L-WRSI) Products
(Version 1.0, July 2024)
The water requirement satisfaction index (WRSI) is an indicator of crop performance based on the availability of water to the crop during a growing season. FAO studies have shown that WRSI can be related to crop production using a linear yield-reduction function specific to a crop (FAO, 1977; FAO, 1979; FAO, 1986). Verdin and Klaver (2002) demonstrated a Geographic information System (GIS) implementation of WRSI in Southern Africa and Senay and Verdin (2003) implemented an operational version of WRSI for FEWS NET, with modifications to develop a seasonally dynamic WRSI.
To expand on the functionality of the WRSI to all landscapes, including non-crop regions, the Landscape Water Requirement Satisfaction Index (L-WRSI) was created. L-WRSI is generated using the VegET model (Senay, 2008; Senay and others, 2023) and was developed to timely process and integrate readily available global weather and remote sensing datasets using water balance modeling techniques for monitoring rainfed agricultural systems. Reference evapotranspiration (ETo), a soil stress coefficient (Ks), and a phenology-based crop coefficient (Kcp) derived from remotely sensed data are used to determine daily soil moisture, runoff (R), and actual evapotranspiration (ETa) using the root-zone as a control volume. The soil water level is determined using a daily soil water balance accounting. The VegET model (v2.0) has been updated with improved parameterization to be more inclusive of hydrologic processes and for computing efficiency (Senay and others, 2023). The new modifications to the model include the incorporation of snowpack and snowmelt processes and the separation of runoff into surface runoff and deep drainage (Figure 1).
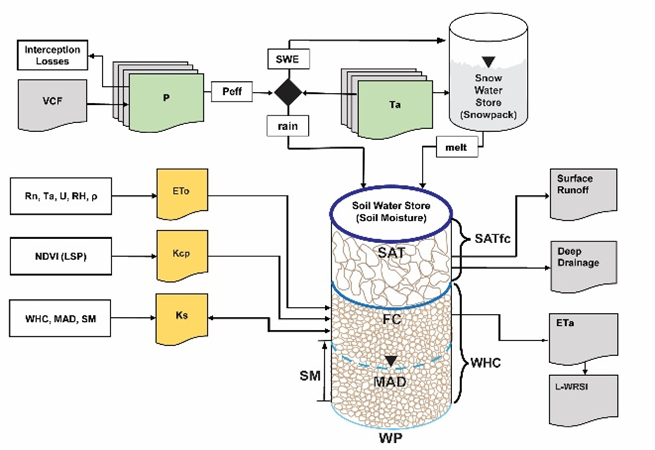
Figure 1. Schematic representation of the updated VegET model (v2.0). The Soil Water Store is defined by two major sections: “gravity water” is filled once the soil moisture is above field capacity (FC) and “plant available water” is the section between FC and permanent wilting point (WP). VCF: vegetation continuous field, P: precipitation, Peff: effective precipitation, SWE: snow water equivalent, Ta: air temperature; ETo: reference ET, Rn: net radiation, U: wind speed, RH: relative humidity, ρ = air pressure, Kcp: landscape water use coefficient, LSP: land surface phenology, Ks: soil stress coefficient, WHC: water holding capacity, MAD: maximum allowable depletion, SM: soil moisture, SAT, soil saturation, SATfc: volume between SAT and FC, L-WRSI: landscape Water Requirement Satisfaction Index.
Data Products:
L-WRSI:
The spatially explicit Landscape Water Requirement Satisfaction Index (L-WRSI) is an indicator of landscape performance, which could also be used for monitoring crop production based on the availability of precipitation and soil moisture to meet crop or landscape water requirements (ETc) during the growing season.
To create the L-WRSI, first the CHIRPS (Funk and others, 2015) precipitation data is acquired and the “nodata” pixels are filled. The VegET model generates daily ETa and ETc, which are summarized to a dekadal time step (~ 10 days). The most important inputs to the model are precipitation and ETo. Here is a list of all inputs and parameters to determine ETa and ETc to calculate L-WRSI:
Table 1: VegET Key Model Inputs and Parameters for Developing L-WRSI in Africa.
| Parameters | Spatial Resolution | Temporal Resolution | Source |
|---|---|---|---|
| Precipitation | 0.05° | Daily; 1981-current | CHIRPS |
| Land Surface Phenology | 1000m | Every 8 days; 2003-2017 | MODIS NDVI |
| Reference Evapotranspiration | 0.625° x 0.5° | Daily; 1981-2010 (climatology) | NOAA ETo (Hobbins and others, 2023) |
| Air temperature | 1000m | Monthly; 1981-2010 (climatology) | CHELSA (Karger and others, 2017) |
| Soil properties | 250m | Static | ISRIC |
| Interception | 250m | Static | MODIS VCF |
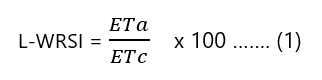
The L-WRSI is calculated (Equation 1) as the ratio of seasonal ETa to the seasonal ETc for the last 3 months (9 dekads) to create a rolling 3-month product that is advanced every dekad. The spatial resolution is 1km and the extent comprises of the continent of Africa and Yemen.
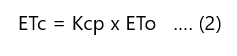
ETc is calculated (Equation 2) for each pixel by adjusting the reference crop ETo using Kcp, which is a phenology-based landscape water use coefficient.
L-WRSI in an index ranging in value from 0 to 100 and displayed with the following legend.
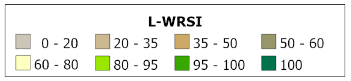
Here is an example (Figure 2) for July 11-20th, 2024 (showing the season for April 21-30 through July 11-20, 2024).

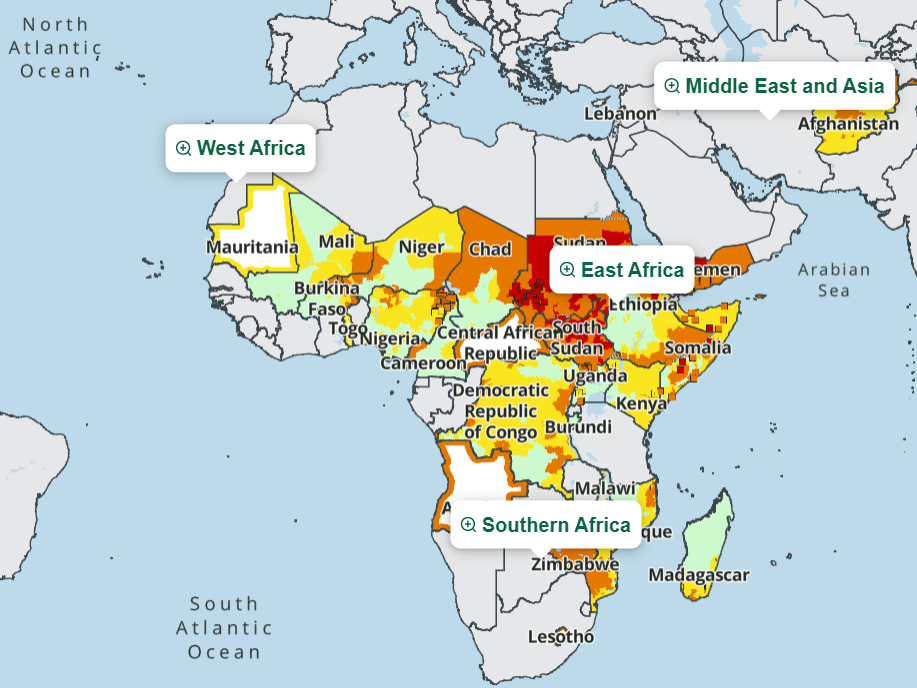
Figure 2. L-WRSI data product for a 3-month season ending in July dekad 2, 2024 (July 11-20th, 2024). A value 100 indicates the 3-month precipitation meets the water requirement of the landscape fully.
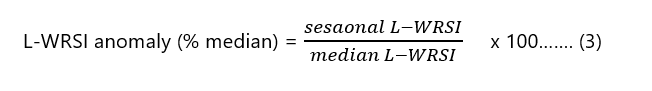
L-WRSI anomaly:
The anomaly is a percent median based on long-term median of 40 years (1982-2021) (Equation 3):
The legend of L-WRSI anomaly uses a similar legend as the ETa Anomaly.
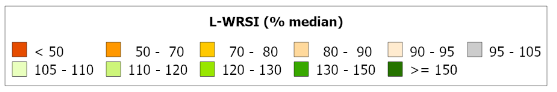
Figure 3 shows an example graphic for July 11-20th, 2024 (showing the season for April 21-30 through July 11-20, 2024).

Figure 3. L-WRSI anomaly product (% median) for a 3-month season ending in July dekad 2, 2024 (July 11-20th, 2024).
Interpretation of the L-WRSI anomaly data:
The large area in orange/red shows a large negative anomaly. This is mainly due to a small change over a generally low out-of-season L-WRSI. During the dry season, the median L-WRSI could be close to 0.0. A small positive or negative change will exaggerate the magnitude of the index. Care should be taken to understand the timing of the L-WRSI for a reasonable interpretation of the index. The map in Figure 3 indicates the dry 2024 season in Southern Africa was drier than the median. The L-WRSI is more stable once the season is established, i.e. 2-3 dekads after the rains have started and becomes more reliable once the season is halfway through.
Masked Areas in L-WRSI anomaly:
The anomaly map graphics have a desert mask applied to areas that cannot be reliably monitored because of insufficient rainfall or are not of interest for crop monitoring purposes. The mask is shown in Figure 4.
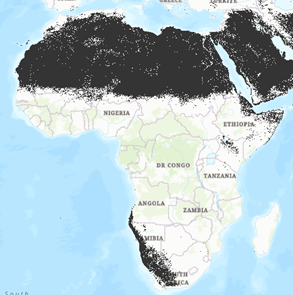
Figure 4. Mask applied to L-WRSI anomaly data.
Timeseries Summary of L-WRSI:
Timeseries of dekadal L-WRSI can be summarized using administrative boundaries using the EWX tools. The dekadal time series for the Tillaberi district in Niger (Figure 5) shows the current 3-month L-WRSI for 2024 season is running above the median promising an above average performance if precipitation continues at the current rate. The known drought year of 1984 shows L-WRSI below the median confirming the dry conditions experienced that year.
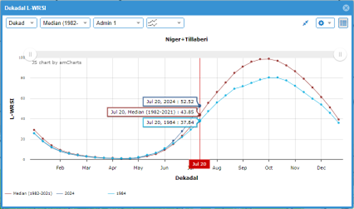
Figure 5: Time series of L-WRSI for Tillaberi district in Niger.
The timeseries chart also helps interpret the anomaly map graphics better by looking at the timing of the L-WRSI in relation to the general seasonality of the growing calendar. L-WRSI anomalies can show large differences when a small change occurs in the dry season or at the beginning of the growing season. Consulting the L-WRSI timeseries is important for contextual interpretation of the L-WRSI anomaly graphics.
References:
FAO, 1977. Crop water requirements. FAO Irrigation and Drainage Paper No. 24, by Doorenbos J and W.O. Pruitt. FAO, Rome, Italy.
FAO, 1979. Agrometeorological crop monitoring and forecasting. FAO Plant Production and Protection paper No. 17, by M. Frère and G.F. Popov. FAO, Rome, Italy.
FAO, 1986. Early Agrometeorological crop yield forecasting. FAO Plant Production and Protection paper No. 73, by M. Frère and G.F. Popov. FAO, Rome, Italy.
Funk, C., Peterson, P., Landsfeld, M., Pedreros, D., Verdin, J., Shukla, S., Husak, G., Rowland, J., Harrison, L., Hoell, A. and Michaelsen, J., 2015. The climate hazards infrared precipitation with stations—a new environmental record for monitoring extremes. Scientific data, 2(1), pp.1-21.
Hobbins, M., Jansma, T., Sarmiento, D.P., McNally, A., Magadzire, T., Jayanthi, H., Turner, W., Hoell, A., Husak, G., Senay, G. and Boiko, O., 2023. A global long-term daily reanalysis of reference evapotranspiration for drought and food-security monitoring. Scientific Data, 10(1), p.746.
Karger, D.N., Conrad, O., Böhner, J., Kawohl, T., Kreft, H., Soria-Auza, R.W., Zimmermann, N.E., Linder, H.P. and Kessler, M., 2017. Climatologies at high resolution for the earth’s land surface areas. Scientific data, 4(1), pp.1-20.
Senay, G.B. and Verdin, J., 2001. Using a GIS-Based Water Balance Model to Assess Regional Crop Performance. Proceedings of the Fifth International Workshop on Application of Remote Sensing in Hydrology, October 2-5, 2001, Montpellier, France.
Senay, G.B., 2008. Modeling Landscape Evapotranspiration by Integrating Land Surface Phenology and a Water Balance Algorithm. Algorithms 2008, 1, 52-68. https://doi.org/10.3390/a1020052
Senay, G.B., Kagone, S., Parrish, G.E.L., Khand, K., Boiko, O., Velpuri, N.M., 2023. Improvements and Evaluation of the Agro-Hydrologic VegET Model for Large-AreaWater Budget Analysis and Drought Monitoring. Hydrology 2023, 10, 168. https://doi.org/10.3390/hydrology10080168
Verdin, J. and Klaver, R., 2002. Grid cell-based crop water accounting for the famine early warning system. Hydrological Processes, 16:1617-1630.
Related FEWS NET Services
The Famine Early Warning Systems Network (FEWS NET) is a leading provider of early warning and analysis on acute food insecurity around the world. Explore our other services at the following: