Afghanistan eMODIS NDVI irrigated areas (Basin) Overview
- Home
- »
- Software Tools
- »
Afghanistan eMODIS NDVI irrigated areas (Basin)
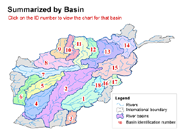
Afghanistan eMODIS NDVI irrigated areas (Basin)
eMODIS NDVI irrigated area - Summarized by Basin. Irrigated area maps identify the irrigated cropland across country annually. To map the irrigated areas consistently over time, a geospatial model was developed and driven by remotely sensed Normalized Difference Vegetation Index (NDVI) data. The near-real time smoothed 10-day NDVI composites with intervals every 5 days from the Moderate Resolution Imaging Spectroradiometer (MODIS) sensor, known as eMODIS, at 250m spatial resolution are used to create seasonal NDVI time series with peak NDVI identified. Seasonal peak values and time series were used in a threshold-dependent decision tree algorithm specific to dry and wet years and applied on pre-classified non-agricultural masked out lands to map irrigated areas. The maps were created as a means of distinguishing the spatial distribution and interannual variability in irrigated areas. Knowledge of such variability and its relation to production can be an important tool in monitoring food security condition.