Daily NOAA RFE and GFS Forecast
- Home
- »
- Search
- »
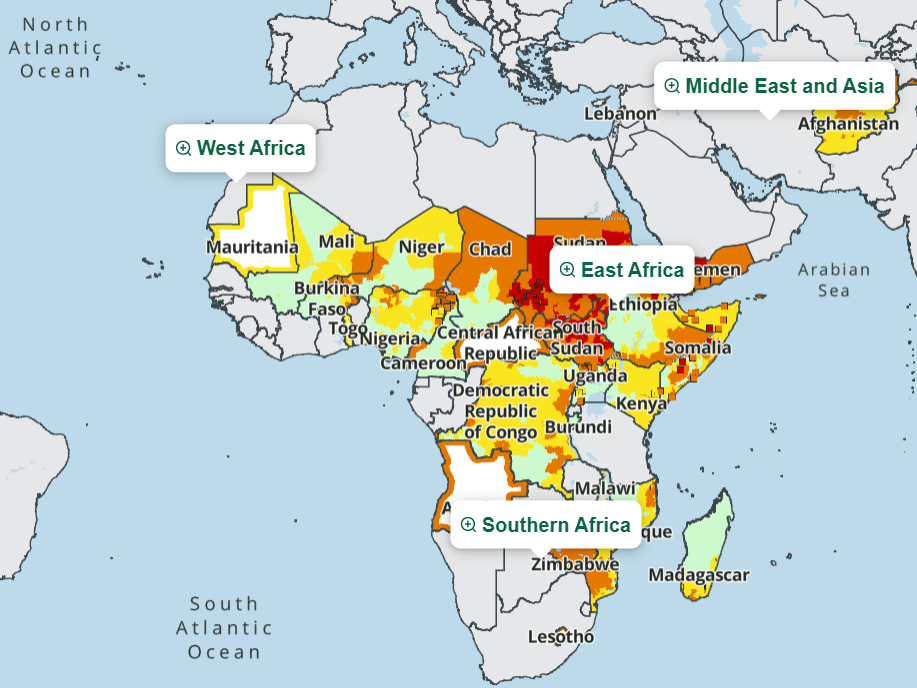
- Africa
- »
- Continental Africa
- »
Data Sets
Daily Period
Continental Africa
Loading subregion products...
Download
Available Tools
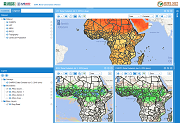
The Early Warning eXplorer (EWX) software is an interactive web-based mapping tool that allows users to visualize continental-scale rainfall estimate (RFE), land surface temperature (LST) and normalized difference vegetation index (NDVI) data and anomalies at varied time steps and review time series analyses.
The Early Warning eXplorer (EWX) Lite software is an interactive web-based mapping tool that allows users to visualize time series of rainfall, NDVI, evapotranspiration, land surface temperature and snow water volume, where applicable. The EWX Lite allows users to access the same time series database that drives the standard EWX without having to load raster imagery which can inhibit performance in areas with poor internet connectivity.
Product Documentation
As of January 1, 2001, RFE version 2.0 was implemented by the NOAA Climate Prediction Center (CPC). This algorithm replaced the dekadal (or 10-day) version 1.0 that was operational from 1995 through 2000 (Herman et al., 1997). A detailed description of the NOAA CPC daily RFE 2.0 data can be found at the bottom of the web page http://www.cpc.ncep.noaa.gov/products/fews/rfe.shtml The RFE 2.0 daily (06Z to 06Z) data are compiled over three geographic areas or windows for the FEWS NET project. The windows and their bounding coordinates are:
All data are in geographic coordinates at 0.10 degree resolution. Each region's daily data are downloaded from NOAA/CPC and converted into ArcInfo integer (to the nearest whole millimeter) *.bil images which are then zipped and staged at https://edcftp.cr.usgs.gov/?dir=project/fews. All data remain on this server for 8 days before being auto-deleted. The Africa window data are under the africa sub-directory. The Central Asia window data are under the afghan sub-directory, and the South Asia window data are under the seasia sub-directory. The naming convention for the daily image zip file is rain_YYYYJDA.tar.gz where YYYY is the 4 digit year and JDA is the 1-to-3 digit day of the year. Each daily rainfall file is a UNIX *.tar.gz file which contains the ArcInfo *.bil image and related files (i.e. .bil, .blw, .hdr, .stx, .clr) for that day. In the case of Africa, the entire collection is available through the FEWS NET Bulk RFE Data Download page at http://earlywarning.usgs.gov/fews/datadownloads/Continental Africa/Dekadal RFE.The individual daily RFE images are ~65-80 KB per file. The daily data are provided for download in three formats: daily, monthly daily data (~2MB per month), and annual daily data (~25 MB per year). 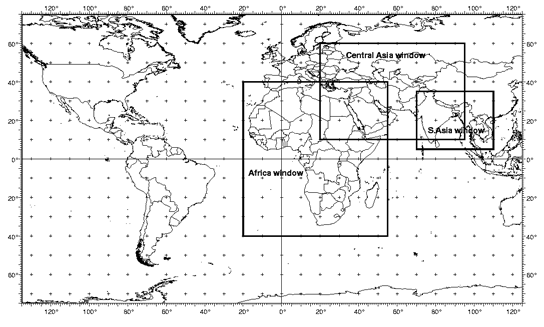 The Global Forecast System (GFS) precipitation data are provided on a daily basis by the Africa desk of the NOAA Climate Prediction Center (http://www.cpc.ncep.noaa.gov/). These data are 7 day forecasts of precipitation at 0.25 degree resolution with a global extent. Each "day" is 00z to 00z. More information on the GFS data can be found at http://www.emc.ncep.noaa.gov/GFS/. Graphic images are provided for both global and regional extents from the original data. The global extent graphics are for the 1st day of the 7-day period and for the total 7-day accumulation. The regional or country specific graphics show individual days for the first 6 of the 7-day forecasts, and are displayed in conjunction with the past 6 days of rainfall estimates. The following links show these data: Global 1-day http://earlywarning.usgs.gov/fews/product/79 Global 7-day http://earlywarning.usgs.gov/fews/product/80 Africa http://earlywarning.usgs.gov/fews/product/59 Afghanistan http://earlywarning.usgs.gov/fews/product/39 Central Asia http://earlywarning.usgs.gov/fews/product/105 South Central Asia http://earlywarning.usgs.gov/fews/product/83 Iraq & Tigres/Euphrates basin http://earlywarning.usgs.gov/fews/product/74 South East Asia http://earlywarning.usgs.gov/fews/product/83 Yemen http://earlywarning.usgs.gov/fews/product/68 Central America http://earlywarning.usgs.gov/fews/product/6 Haiti (Hispaniola) http://earlywarning.usgs.gov/fews/product/18 |