

FEWS USGS Data Access APIs
Overview
This documentation is designed to allow developers to access the FEWS USGS suite of API endpoints to build applications. The endpoints provided for viewing datasets over time, previewing available map layers, viewing and overlaying satellite image collections. The following guide will provide instructions and practical examples for consuming our geospatial data. All of our endpoints provide data that is OGC compliant.
These APIs provide access to the following FEWS USGS data:
- Satellite Imagery Datasets: USGS products include CHIRPS, Evapotranspiration, L-WRSI, LST, NDVI, RFE2, Runoff and Soil Moisture.
- Time Series: Summary statistics for the FEWS geographic areas within Admin1, Admin2, Crop Zones and FEWS NET Mapping Units.
The FEWS Early Warning eXplorer (EWX) is an interactive web-based mapping tool that consumes these APIs.
Terminology
- GeoServer — A tool that shows and serves map layers. In this documentation, you use GeoServer to preview a layer (see how it looks, check its name, and view its dates and metadata).
- Layer — A dataset you can request as a map. Each layer has a name, a region, and a set of dates it supports.
- Granule — One specific date of a layer. A granule is the single map for that day, month, or period.
- Workspace — The folder or grouping a layer belongs to. You need it for the full layer name (workspace:layer).
- Bounding Box (bbox) — The rectangle on the map you want to request. It is defined by four numbers (minX, minY, maxX, maxY).
- Projection (srs) — The coordinate system used for the map. In this documentation EPSG:4326 is used.
- WMS (Web Map Service) — The type of request you use to get a map image from the server.
- GetCapabilities — A parameter value (request=GetCapabilities) that lists details about a layer, including all available dates.
- COGs — Cloud Optimized GeoTIFFs that only get the data they need and can be accessed through a regular HTTP GET request. COGs help reduce data duplication and provide more efficient workflows.
Case Study
FEWS Early Warning eXplorer (EWX)
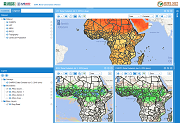
This viewer is an interactive web-based mapping tool that allows users to visualize continent-scale rainfall estimate (RFE), land surface temperature (LST) and normalized difference vegetation index (NDVI) data and anomalies at varied time steps and review time series analyses.
The viewer interface provides a tree of checkboxes to select overlays and boundaries. Based on what the user selects groups of API requests are made to provide "tiles" that are added to the map.
Other viewers within FEWS will have different interfaces, layers, and options for the user to interact with.
APIs Utilized
Get global country Boundaries
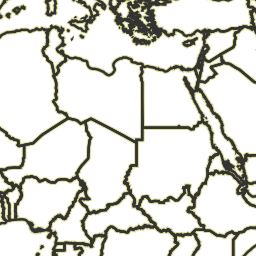 https://dmsdata.cr.usgs.gov/geoserver/gwc/service/wms?REQUEST=GetMap&SERVICE=WMS&VERSION=1.3.0&FORMAT=image%2Fpng&STYLES=fews_admin_0_ngviewer&TRANSPARENT=TRUE&LAYERS=fews_g2008_0%3Ag2008_0&TILED=true&SRS=EPSG%3A3857&jsonLayerId=globalAdmin0&WIDTH=256&HEIGHT=256&CRS=EPSG%3A3857&BBOX=0%2C0%2C5009377.085697311%2C5009377.085697311
Get CHIRPS Data Pentadal (Jun 26th, 2026) (mm) global overlays
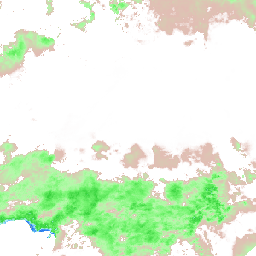 https://dmsdata.cr.usgs.gov/geoserver/gwc/service/wms?REQUEST=GetMap&SERVICE=WMS&VERSION=1.3.0&FORMAT=image%2Fpng&STYLES=fews_chirps_pentad_data_raster_ngviewer&TRANSPARENT=TRUE&LAYERS=fews_chirps_global_pentad_data%3Achirps_global_pentad_data&TILED=true&SRS=EPSG%3A3857&jsonLayerId=chirps_global_pentad_data&TIME=2026-06-26&WIDTH=256&HEIGHT=256&CRS=EPSG%3A3857&BBOX=0%2C0%2C5009377.085697311%2C5009377.085697311
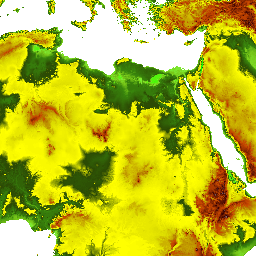
Get GTOPO 30 Elevation (meters) overlay
Get LandScan Population (# people/cell)
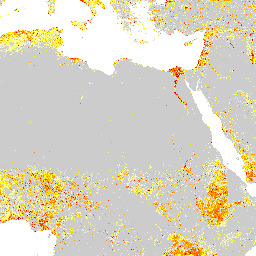 https://dmsdata.cr.usgs.gov/geoserver/gwc/service/wms?REQUEST=GetMap&SERVICE=WMS&VERSION=1.3.0&FORMAT=image%2Fpng&STYLES=fews_landscan_raster_ngviewer&TRANSPARENT=TRUE&LAYERS=fews_landscan_2024%3Alandscan_2024&TILED=true&SRS=EPSG%3A3857&jsonLayerId=population&WIDTH=256&HEIGHT=256&CRS=EPSG%3A3857&BBOX=0%2C0%2C5009377.085697311%2C5009377.085697311
Data Access
Get Image Collection Details
1. Get the list of layers
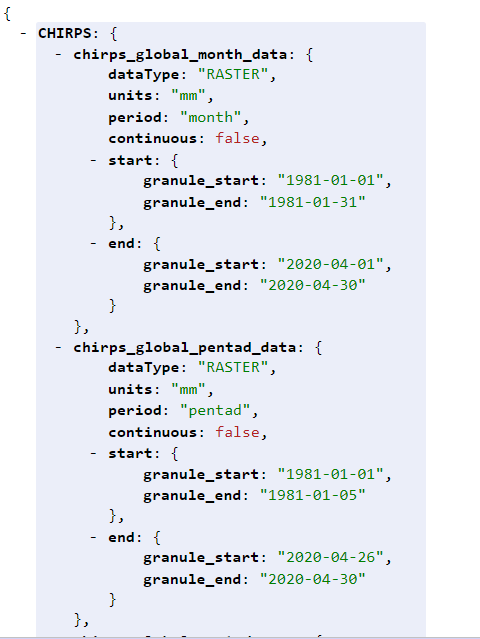
Use the following endpoint to see all available datasets and their time ranges:
https://edcintl.cr.usgs.gov/geoengine5/rest/version/5.0/config
Using the format of (key:value), this JSON tells you:
- Layer Names
- Region, click to view all
- • Africa, africa
- • East Africa, africa-east
- • West Africa, africa-west
- • Alaska, alaska
- • Asia, asia
- • Camcar
- • Central America, centralamerica
- • Central Asia, centralasia
- • Indo-Pacific, centralindopacific
- • Continental US, conus
- • Global, global
- • Haiti, haiti
- • Hawaii, hawaii
- • Hispaniola, hispaniola
- • Prusvi, prusvi
- • South America, southamerica
- • Western Continental US, westernconus
- Period Type, click to view all
- • Day, day
- • Pentadal, pentad
- • Pentadal 10 Day Composite, pentad_10daycomposite
- • Fire Danger Week, firedanger_week
- • Dekadal, dekad
- • Month, month
- • 2 Month, 2month
- • 3 Month, 3month
- • Year, year
- Start/End dates
- Available Granule Dates
- A granule is the start and end dates of the available periodcities within the users' selected start and end dates.
- If the selected dates were 01-01-2026 to 12-31-2026 and the periodicity was Month, the granules would then be each month.
2. View layer capabilities
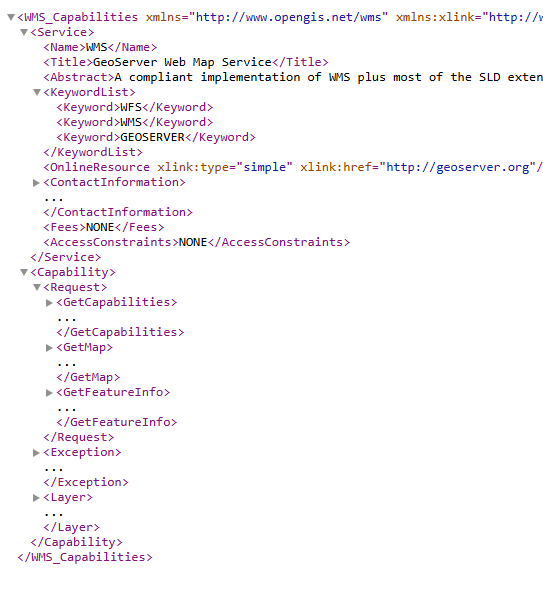
Available capabilities of a layer can be viewed by using the request=GetCapabilities parameter and value pair. For each satellite image collection, you can generate an OGC WMS GetCapabilities request to understand the capabilities of the WMS layer.
https://dmsdata.cr.usgs.gov/geoserver/fews_chirps_global_month_data/ows?service=wms&version=1.3.0&request=GetCapabilities
The JSON provided shows specific:
- Formats for map (GetMap)
- Layer features (GetFeatureInfo)
- List of available projections (Layer)
- Bounding box information (BoundingBox)
- Viewer styles with legend information (Style)
Data Access
Get Data
1. Displays layer previews and spatial data for different periodicies
This endpoint is used to preview collections. Layer and workspace parameters can be utilized to view different shapefiles and periodicy-based layers.
https://dmsdata.cr.usgs.gov/geoserver/{layer}/wms?service=WMS&version=1.1.0&request=GetMap&layers={workspace}%3A{layer}&bbox={bbox coordinates}&width={width}&height={height}&srs={projection}&styles=&format=application/openlayers

Parameters
- {layer}: data layer name
- Layers: {workspace}%3A{layer} workspace is a collection of layers, this can be found on GeoServer by entering the layer in the field below the Workspace field
- Bbox: coordinates for map area
- Width/height: can be customized but keep to 4:3 proportion
- Srs: map or layer projection
- Format: can vary depending on data needed, see Layer Preview for options
- Styles: viewer defined styling
2. Get Time Series Data
Using a workspace/layer combination specific coordinates time series data can be accessed. This endpoint also provides zonal statistics and mean/median data.
https://edcintl.cr.usgs.gov/rest/timeseries/version/5.0/vector_dataset/{shapefile}/raster_dataset/{collections}/periodicity/{periodicity}/statistic/{statistic}/lat/{lat}/lon/{lon}/seasons/{seasons}/zonal_stat_type/{zonalStatType}/mean-median/{meanMedian}Parameters
- Shapefile: Geometry for selected area of interest
- Collections: Results per the users' query.
- Periodicity: The amount of time between individual collections.
- Lat/Lon: latitude/longitude cooardinates
- Season: comma separated value for specific years
- ZonalStatType: summary statistics calculated for the values of a raster within zones
- MeanMedian: boolean value that gets mean and media data if it exists
3. Request that serves a granule based on different parameters
View a granule at a certain day within the range of measured data and view individual tiles for use within a mapping application. Parameters allow for transparency of granules, if format allows, for layering granules.
https://dmsdata.cr.usgs.gov/geoserver/wms?SERVICE=WMS&VERSION=1.3.0&REQUEST=GetMap&format={format}&TRANSPARENT=true&TILED=true&srs={projection}&TIME=2020-02-26&width={width}&height={height}&bbox={bbox coordinates}&LAYERS={workspace}:{layer}
Parameters
- Transparent: 'true' for formats that allow combined overlays such as "image/png", 'false' if no transparency is needed which works best for "image/jpeg" formats
- Tiled: 'true' if granule is used as an overlay in a map viewer, 'false' if granule is intended to be used individually
- Time: specific day in date range of measured data
COGS Direct Data Access
Get COG Data
1. Request COG data
GeoTIFF data is efficient in that it allows for more efficient workflows on the cloud and only gets the data that it needs. COGs allow for reduction in data duplication and analyzation of problems on a global scale.
The endpoint mirrors that of layer previews and spatial data in #1 above except that the format parameter is "image%2Fgeotiff".
https://dmsdata.cr.usgs.gov/geoserver/{layer}/wms?service=WMS&version=1.1.0&request=GetMap&layers={coordinates}&width={width}&height={height}&srs={projection}&styles=&format=image/geotiff
Parameters
- {layer}: data layer name
- Layers: coordinates for map area
- Width/height: can be customized but keep to 4:3 proportion
- Srs: map or layer projection
- Format: can vary depending on data needed, see Layer Preview for options
- Styles: viewer defined styling
2. Jupyter Notebooks
*Not downloadable yet as they are currently being made more accessible.*
Jupyter notebooks help to facilitate working with COGs from USGS EROS DMS to provide an interactive environment. Notebooks leverage data from DMS data, GeoServer and the GeoEngine API to allow for accessing data based on specific time series, dataset and AOI (area of interest) data. GeoTIFFs can also be clipped from this data as well.
References
- Jupyter : https://jupyter.org
- Stat Spec: https://stacspec.org/en
- DMS Data for COGs : https://dmsdata.cr.usgs.gov/cogs/fews/
- GeoServer : https://dmsdata.cr.usgs.gov/geoserver/gwc/service/wms?
- GeoEngine API : https://edcintl.cr.usgs.gov/geoengine5/rest/version/5.0/config
Related FEWS NET Services
The Famine Early Warning Systems Network (FEWS NET) is a leading provider of early warning and analysis on acute food insecurity around the world. Explore our other services at the following: