RFE Anomaly -- Malaria
- Home
- »
- Search
- »
- Africa
- »
- Continental Africa
- »
Data Sets
Dekadal Period
Continental Africa
Loading subregion products...
Download
Product Documentation
|
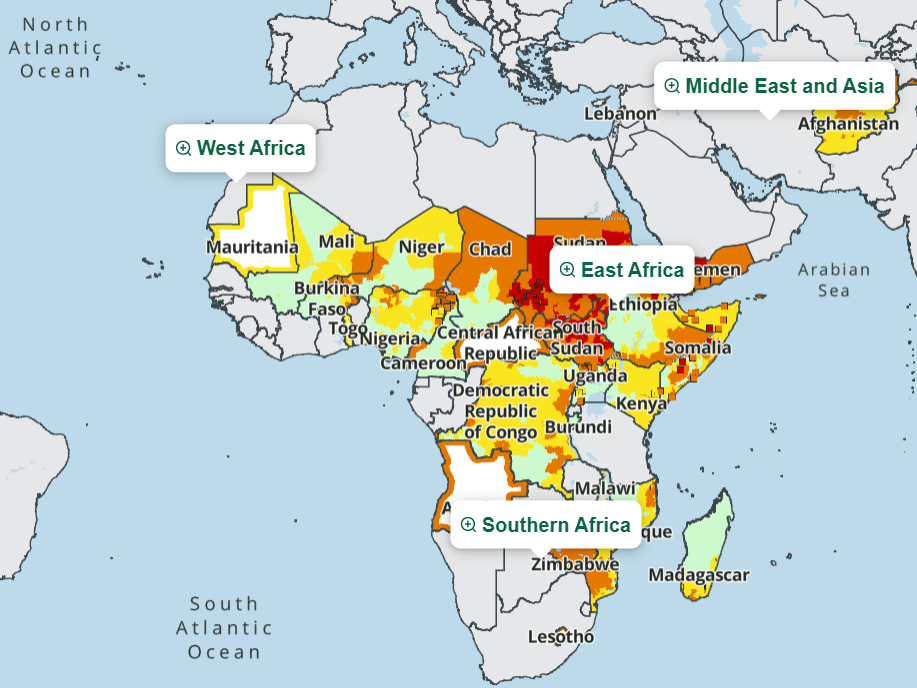
(Last update: 3 February 2004) Monitoring current rainfall anomalies in zones at epidemic risk Rainfall is one of the major factors influencing malaria transmission in semi-arid and desert-fringe areas of Africa. Epidemics may occur after excessive rains, usually with a lag time of several weeks during which mosquito vector populations and malaria infections gradually increase. Epidemics following drought and poor food security conditions can be especially severe. During a recent meeting on Prevention and Control of Epidemics, the Roll Back Malaria (RBM) Technical Support Network (TSN) recommended the development of a simple epidemic-risk monitoring tool for these marginal transmission areas, with the purpose of providing timely alerts to control programs and RBM partners working in areas of increased epidemic risk. This tool would be based on the difference in current rainfall compared to the average, and made available via the Internet in a frequently updated map format. These maps are available in experimental form through the Africa Data Dissemination Service (ADDS) website supported by USAID FEWS NET. The maps provide a simple indicator of changes in malaria risk in marginal transmission areas based solely on rainfall, showing differences above and below expected levels. Current rainfall (RFE) (Ping-Ping Xie's RFE) is obtained from NOAA Climate Prediction Center. The 5-year average spans 1998 - 2002 and is a combination of A. Herman's RFE from 1998 to 2000 and Ping-Ping Xie's RFE for 2001 and 2002 data from the NOAA Climate Prediction Center. This is a modification from the original procedure that used the CHARM data set for the average. While the NOAA 5-year average is for a shorter time period than the CHARM data set, we believe it is more appropriate for current Africa-wide comparison of rainfall. Maps are updated every ten days. The maps use a mask to exclude areas where malaria is considered to be endemic (as opposed to epidemic), or absent. This mask is based solely on climatic constraints to malaria transmission (including climatic variability), and as yet does not account for areas where historic control has eliminated epidemic risk in the northern and southern margins of the continent. The maps have been tested against laboratory-confirmed malaria incidence figures in districts in Botswana where they showed a strong association. Their use and validation elsewhere is encouraged. Description of the imagery available for download Before creating binary files of these data, the original difference images were recoded into categories:
These recoded values were converted into a binary byte image (BIL) with associated color (CLR), header, (HDR), statistics (STX), and world (BLW) files. File naming conventions are "epi_riskYYMMD.bil" where YY is a two-digit year, MM is a two-digit month, and D is a one-digit number for the dekad of the month. For example, the file epi_risk03063.bil is for the third dekad of June 2003 (June 21-30 2003). All five files are compressed with WinZip into "epi_riskYYMMD.zip". These images are in geographic coordinates with 801 rows and 751 columns of byte data for 602,063 bytes. Pixel size is 0.1 degree. The coordinate of the center of the upper left pixel is -20° 0' 0" longitude and 40° 0' 0" latitude. |
Related FEWS NET Services
The Famine Early Warning Systems Network (FEWS NET) is a leading provider of early warning and analysis on acute food insecurity around the world. Explore our other services at the following: