RFE (Rainfall Estimate)
- Home
- »
- Search
- »
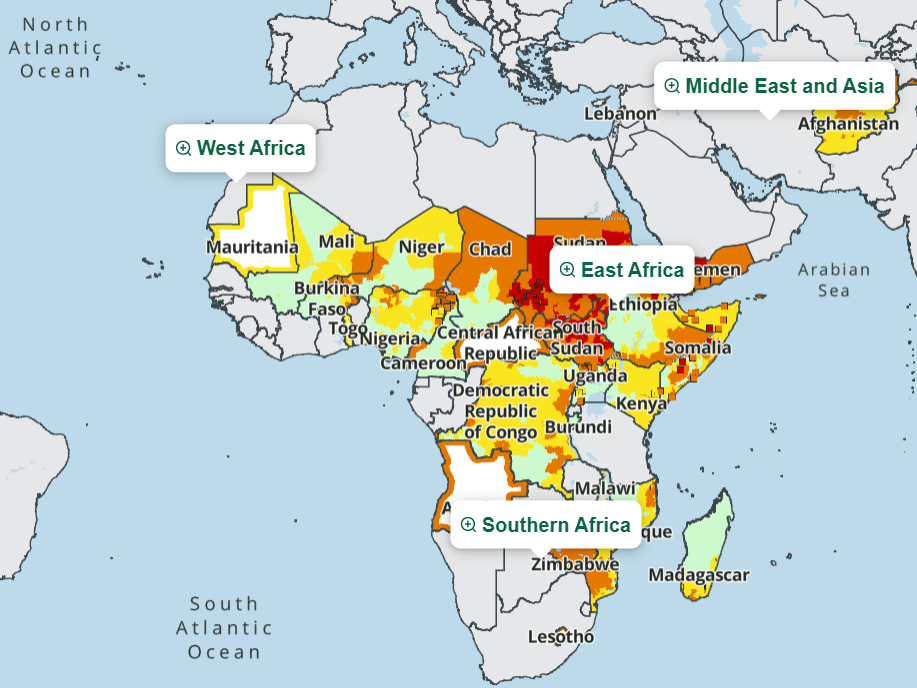
- Africa
- »
- Continental Africa
- »
Data Sets
Dekadal Period
Continental Africa
Loading subregion products...
Download
Available Tools
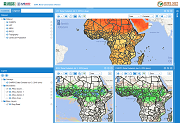
The Early Warning eXplorer (EWX) software is an interactive web-based mapping tool that allows users to visualize continental-scale rainfall estimate (RFE), land surface temperature (LST) and normalized difference vegetation index (NDVI) data and anomalies at varied time steps and review time series analyses.
The Early Warning eXplorer (EWX) Lite software is an interactive web-based mapping tool that allows users to visualize time series of rainfall, NDVI, evapotranspiration, land surface temperature and snow water volume, where applicable. The EWX Lite allows users to access the same time series database that drives the standard EWX without having to load raster imagery which can inhibit performance in areas with poor internet connectivity.
Product Documentation
|
RFE data background: As of January 1, 2001, RFE version 2.0 has been implemented by NOAA's Climate Prediction Center. Created by Ping-Ping Xie, this replaces RFE 1.0, the previous rainfall estimation algorithm that was operational from 1995 through 2000 (Herman et al., 1997). RFE 1.0 used an interpolation method to combine Meteosat and Global Telecommunication System (GTS) data, and included warm cloud information for the dekadal estimates. RFE 2.0 uses additional techniques to better estimate precipitation while continuing the use of cold cloud duration, or CCD (derived from cloud top temperature), and station rainfall data. Meteosat 7 geostationary satellite infrared data are acquired in 30-minute intervals, and areas depicting cloud top temperatures of less than 235K are used to estimate convective rainfall. WMO GTS data from ~1000 stations provide station rain gauge totals, and are taken to be the true rainfall within 15-km radii of each station. Two new satellite rainfall estimation instruments are incorporated into RFE 2.0, namely, the Special Sensor Microwave/Imager (SSM/I) on board Defense Meteorological Satellite Program satellites, and the Advanced Microwave Sounding Unit (AMSU) on board NOAA satellites. SSM/I estimates are acquired at 6-hour intervals, while AMSU rainfall estimates are available every 12 hours. RFE 2.0 obtains the final daily rainfall estimation using a two part merging process. All satellite data are first combined using the maximum likelihood estimation method, then GTS station data are used to remove bias. For more information on the FEWS RFE algorithm, please refer to the RFE 2.0 documents at http://www.cpc.ncep.noaa.gov/products/fews/rfe.shtml. Note: Scroll to the bottom of the page. The daily data are in geographic coordinates. The daily totals are summed to produce the dekadal totals and the dekadal totals are then projected to the coordinate system described below. Dekadal RFE data characteristics: Source: NOAA-CPC Time step: 10-day (dekadal) Resolution: 8km Projection: Albers equal area conic File Format: Windisp image, byte (8 bit); Generic BIL, "Integer" (16 bit). Africa Continental Details: Coordinates for corners: Lower left lat : -42.243 deg Lower left lon : -23.490 deg Upper left lat : 43.711 deg Upper left lon : -24.600 deg Lower right lat : -42.242 deg Lower right lon : 63.414 deg Upper right lat : 43.712 deg Upper right lon : 64.523 deg Image size : 1152 rows x 1152 cols Center lat,lon : 1.000000, 20.000000 Pixel size h x w : 8.000000 km x 8.000000 km Origin of latitudes : 1.000000 deg Central meridian : 20.000000 deg First std parallel : -19.000000 deg Second std parallel : 21.000000 deg Projection = ALBERS Conical Equal-area projection uses the clarke 1866 spheroid References: Xie, P. and P. A. Arkin, 1997. A 17-year monthly analysis based on gauge observations, satellite estimates, and numerical model outputs. Bulletin of the American Meteorological Society 78(11): 2539-58" |
Related FEWS NET Services
The Famine Early Warning Systems Network (FEWS NET) is a leading provider of early warning and analysis on acute food insecurity around the world. Explore our other services at the following: