FEWS NET Software Tools
- Home
- »
Software Tools
EWX
The Early Warning eXplorer (EWX) software is an interactive web-based mapping tool that allows users to visualize continental-scale rainfall estimate (RFE), land surface temperature (LST) and normalized difference vegetation index (NDVI) data and anomalies at varied time steps and review time series analyses.
EWX Lite
The Early Warning eXplorer (EWX) Lite software is an interactive web-based mapping tool that allows users to visualize time series of rainfall, NDVI, evapotranspiration, land surface temperature and snow water volume, where applicable. The EWX Lite allows users to access the same time series database that drives the standard EWX without having to load raster imagery which can inhibit performance in areas with poor internet connectivity.

GeoTools
GeoTools is a single QGIS plugin that includes both GeoCLIM and GeoWRSI. GeoCLIM is a component of a suite of agroclimatic analysis tools developed by FEWS NET/United States Geological Survey (USGS) in collaboration with the
Climate Hazard Center (CHC) at the University of California Santa Barbara (UCSB). GeoCLIM is designed specifically for analyzing climatological data
such as rainfall, temperature, and evapotranspiration. It offers a range of accessible functions tailored for climate analysis in agricultural development.
The GeoWRSI is a geospatial, stand-alone implementation of the Water Requirements Satisfaction Index (GeoWRSI), as implemented by the U.S. Geological Survey (USGS) for the Famine Early Warning Systems Network (FEWS NET) activity. The program runs a crop-specific water balance model for a user-selected crop in a user-specified region in the world, using raster data inputs. The program produces a range of outputs which can either be used qualitatively to help assess and monitor crop conditions during the crop growing season or regressed with yields to produce yield estimation models and yield estimates. In addition, the program has several tools for validation, enhancement and analysis of both input and output datasets. Other tools are available to post-process the water balance outputs so that they can be used for yield estimation.
The GeoWRSI is a geospatial, stand-alone implementation of the Water Requirements Satisfaction Index (GeoWRSI), as implemented by the U.S. Geological Survey (USGS) for the Famine Early Warning Systems Network (FEWS NET) activity. The program runs a crop-specific water balance model for a user-selected crop in a user-specified region in the world, using raster data inputs. The program produces a range of outputs which can either be used qualitatively to help assess and monitor crop conditions during the crop growing season or regressed with yields to produce yield estimation models and yield estimates. In addition, the program has several tools for validation, enhancement and analysis of both input and output datasets. Other tools are available to post-process the water balance outputs so that they can be used for yield estimation.
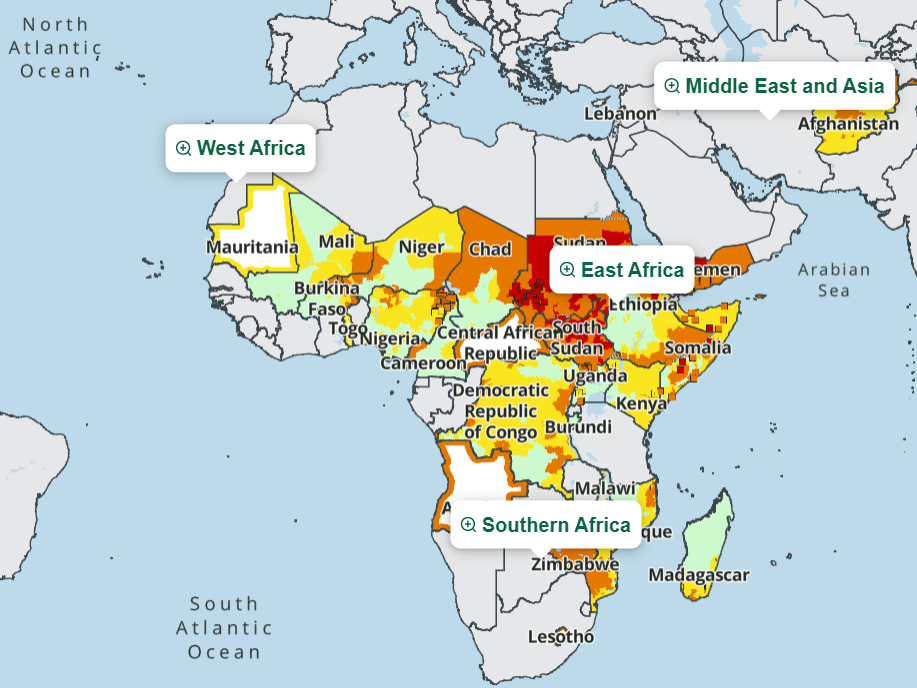
Water Point Viewer
The water point map viewer, which monitors several water points from Mali to Somalia, will help a range of government and non-government actors understand the current availability of water for livestock and human consumption. This will inform food security analysis, humanitarian assistance planning, and a range of other activities.
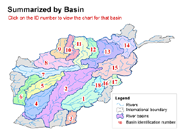
Afghanistan eMODIS NDVI irrigated areas (Basin)
eMODIS NDVI irrigated area - Summarized by Basin. Irrigated area maps identify the irrigated cropland across country annually. To map the irrigated areas consistently over time, a geospatial model was developed and driven by remotely sensed Normalized Difference Vegetation Index (NDVI) data. The near-real time smoothed 10-day NDVI composites with intervals every 5 days from the Moderate Resolution Imaging Spectroradiometer (MODIS) sensor, known as eMODIS, at 250m spatial resolution are used to create seasonal NDVI time series with peak NDVI identified. Seasonal peak values and time series were used in a threshold-dependent decision tree algorithm specific to dry and wet years and applied on pre-classified non-agricultural masked out lands to map irrigated areas. The maps were created as a means of distinguishing the spatial distribution and interannual variability in irrigated areas. Knowledge of such variability and its relation to production can be an important tool in monitoring food security condition.
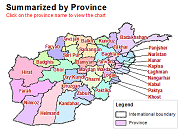
Afghanistan eMODIS NDVI irrigated areas (Province)
eMODIS NDVI irrigated area - Summarized by Province. Irrigated area maps identify the irrigated cropland across country annually. To map the irrigated areas consistently over time, a geospatial model was developed and driven by remotely sensed Normalized Difference Vegetation Index (NDVI) data. The near-real time smoothed 10-day NDVI composites with intervals every 5 days from the Moderate Resolution Imaging Spectroradiometer (MODIS) sensor, known as eMODIS, at 250m spatial resolution are used to create seasonal NDVI time series with peak NDVI identified. Seasonal peak values and time series were used in a threshold-dependent decision tree algorithm specific to dry and wet years and applied on pre-classified non-agricultural masked out lands to map irrigated areas. The maps were created as a means of distinguishing the spatial distribution and interannual variability in irrigated areas. Knowledge of such variability and its relation to production can be an important tool in monitoring food security condition.