BERM (Basin Excess Rainfall Map)
- Home
- »
- Search
- »
- Africa
- »
- Continental Africa
- »
Data Sets
Dekadal Period
Continental Africa
Loading subregion products...
Available Tools
The Early Warning eXplorer (EWX) software is an interactive web-based mapping tool that allows users to visualize continental-scale rainfall estimate (RFE), land surface temperature (LST) and normalized difference vegetation index (NDVI) data and anomalies at varied time steps and review time series analyses.
The Early Warning eXplorer (EWX) Lite software is an interactive web-based mapping tool that allows users to visualize time series of rainfall, NDVI, evapotranspiration, land surface temperature and snow water volume, where applicable. The EWX Lite allows users to access the same time series database that drives the standard EWX without having to load raster imagery which can inhibit performance in areas with poor internet connectivity.
Product Documentation
|
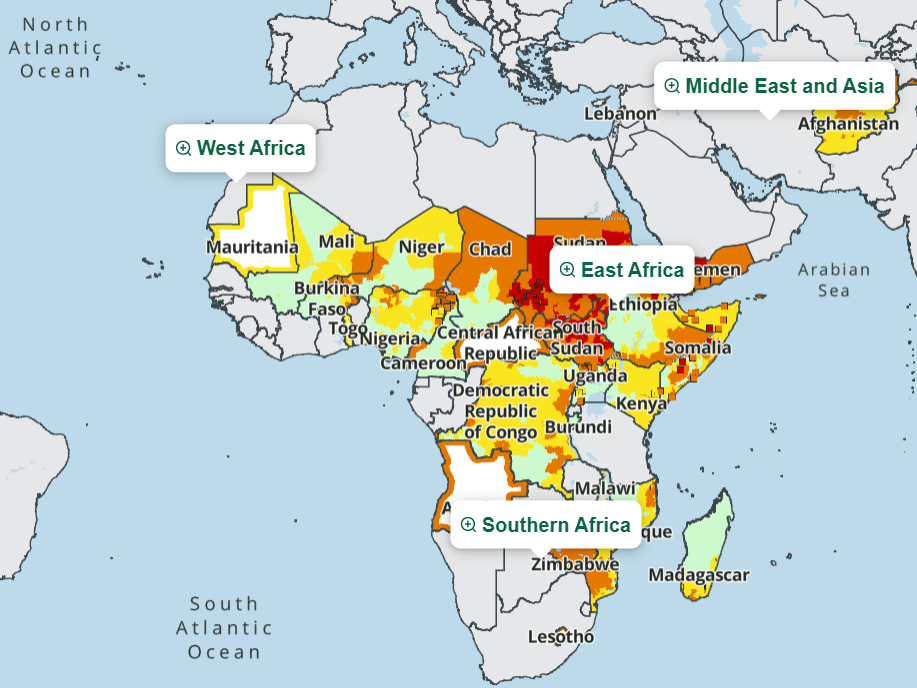
A simple method for identifying areas subject to problems of flooding or excess moisture has been developed through the joint use of satellite rainfall estimates (RFE) and digital maps of basin boundaries and river networks. Maps are produced which highlight basins experiencing above-average rainfall in the previous ten-day period, and river reaches with potentially higher-than-average stream flow. NOAA has produced RFE images (Herman et al., 1997) on a dekadal (10-day) time step for FEWS NET since 1995. The images are composed of 0.1-degree (about 10 km) pixels whose values are the estimated number of millimeters of accumulated rainfall for the dekad. A straightforward application of these images has been their use in conjunction with USGS digital maps of basins and river networks. These have been derived from 1-km resolution topographic data, and are part of a topologically coded (Verdin and Verdin, 1999) global data set known as HYDRO1K. Rainfall estimates are summed over river basin areas for each dekad, and cumulatively for the season. These sums are divided by the corresponding values for long-term average conditions (Hutchinson et al., 1995), and excess rainfall scores are assigned to basin areas and river reaches accordingly - the higher the ratios, the greater the scores. Maps are then produced with color codes indicating relative levels of excess precipitation. These products have been named Basin Excess Rainfall Maps (BERMs). BERM products reveal situations of sustained heavy regional rains that adversely affect food security through flooding and consequent widespread disruption of agriculture, transportation, and market systems. The basin (or catchment) map highlights subbasins (out of approximately 3,000 across the continent) receiving above-average precipitation for the dekad, and cumulatively for the season, by color coding the relevant polygons. The river segment (or stream) map highlights reaches of river receiving above-average amounts of dekadal and seasonal cumulative precipitation according to a similar scoring system. The difference is that a reach of river may receive rainfall from a much larger upstream area than that of the subbasin polygon in which it lies. Thus, a subbasin may not be highlighted because only light rain is occurring locally, while the reach of river passing through it is highlighted, due to heavy rains in upstream catchments. References Herman, A., V. Kumar, P. Arkin, and J. Kousky. 1997. Objectively determined 10-day African rainfall estimates created for famine early warning systems. International Journal of Remote Sensing, v. 18, n. 10, 2147-2159. Hutchinson, M., H. Nix, J. McMahon, K. Ord. 1995. Africa - A topographic and climatic database. Centre for Resource and Environmental Studies, Australian National University, Canberra, CD Version 1.0. Showstack, R. 2000. Scientists and planners look for ways to stem future flood disasters in Mozambique. EOS, Transactions, American Geophysical Union, v. 81, n. 13, 133-137. Verdin, K., and J. Verdin. 1999. A topological system for delineation and codification of the Earth's river basins. Journal of Hydrology, v. 218, 1-12. |
Related FEWS NET Services
The Famine Early Warning Systems Network (FEWS NET) is a leading provider of early warning and analysis on acute food insecurity around the world. Explore our other services at the following: