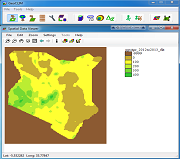
Dekadal Actual Evapotranspiration (ET)
Available Tools
Product Seasonal Calendar
Product Documentation
SSEBop Actual Evapotranspiration Products
(Version 6.0, February 2023)
Evapotranspiration (ET), for the most part, is the combination of transpiration from vegetation and evaporation from soil surfaces. Global actual ET (ETa) version 6 (V6) is produced using the Operational Simplified Surface Energy Balance (SSEBop) model (Senay et al., 2013, 2022) from 2012 to present. The SSEBop is the operational version of the Simplified Surface Energy Balance (SSEB) approach (Senay et al., 2007) , with unique parameterizations for large area applications.
SSEBop combines ET fractions (ETf) generated from remotely sensed Visible Infrared Imaging Radiometer Suite (VIIRS) thermal imagery, updated every 10 days, with climatologic reference ET derived from gridded weather datasets such as TerraClimate by Abatzoglou et al. (2018) for the world and Chiew et al., (2002) for Australia. The unique feature of the SSEBop model is that it uses a pre-defined, seasonally, and spatially dynamic surface psychrometer parameter to calculate ETf as the difference between observed land surface temperature (dry-bulb) and a cold/wet boundary condition (wet-bulb) using the principle of satellite psychrometry (Senay, 2018).
SSEBop V6 is also parameterized using the novel Forcing And Normalizing Operation (FANO) algorithm (Senay et al., 2023) to establish the wet-bulb boundary condition, allowing to robustly model
the spatiotemporal dynamics of ETa in all landscapes and all seasons regardless of vegetation cover density. A recent evaluation of the global ETa product shows promising performance of ETa
Anomaly for drought monitoring purposes while water budget studies, requiring absolute magnitudes, may need to apply a local/region-specific bias correction procedure (Senay et. al, 2020).
ETa data and anomaly products
(current vs. 2013 – 2022) are available at: https://earlywarning.usgs.gov/fews.
The actual ET data unit is millimeters (mm) and the associated color ramp (see Figure 1a.) is available for download as a .style file for ArcGIS and as txt file with RGB color codes. The SSEBop_symbology folder includes instructions on how to add the color ramp in ArcMap and further suggestions on the data visualization.
The anomalies are the ratio of ETa and the corresponding median ETa, expressed as a percent value and have the color ramp (see Figure 1b.) attached. The color ramp, txt file with RGB color codes, and colormap file (.clr) are available in the SSEBop_symbology folder

Figure 1a. Dekadal ETa legend in millimeters (mm)

Figure 1b. Anomaly ET legend in percent (%)
Listed below are all ET products offered:
Yearly ET products:
ET data products as graphics (.png and .pdf), as well as .tif file. The associated color ramp is available as download on the website.
ET anomaly products for every year as graphics (.png and .pdf), as well as .tif including the color ramp.
Monthly ET products:
ET data products for every month in a year as graphics (.png and .pdf), as well as .tif file. The associated color ramp is available as download on the website.
ET anomaly products for every month in a year as graphics (.png and .pdf), as well as .tif file including the color ramp.
Dekadal (10 day) products:
ET data products for every dekad in a year as graphics (.png and .pdf), as well as .tif file. The associated color ramp is available as download on the website.
ET anomaly products for every dekad in a year as graphics (.png and .pdf), as well as .tif file including the color ramp.
Cumulative ET anomaly products:
ET anomaly products are cumulative in intervals of dekads and grouped by the region's main growing season(s).
ET anomaly products for every dekad in a year as graphics (.png and .pdf), as well as .tif file including the color ramp.
References:
Abatzoglou, J., Dobrowski, S., Parks, S. et al. TerraClimate, a high-resolution global dataset of monthly climate and climatic water balance from 1958–2015. Sci Data 5, 170191 (2018). https://doi.org/10.1038/sdata.2017.191
Chiew, F, Q.J. Wang, F. McConachy, R. James, W. Wright, and G. deHoedt, (2002). Evapotranspiration maps for Australia. Hydrology and Water Resources Symposium, Melbourne, 20-23, 2002, Institution of Engineers, Australia.
Senay, G. B., Bohms, S., Singh, R. K., Gowda, P. H., Velpuri, N. M., Alemu, H., & Verdin, J. P. (2013). Operational evapotranspiration mapping using remote sensing and weather datasets: A new parameterization for the SSEB approach. JAWRA Journal of the American Water Resources Association, 49(3), 577-591. https://onlinelibrary.wiley.com/doi/full/10.1111/jawr.12057
Senay, G. B. (2018). Satellite psychrometric formulation of the Operational Simplified Surface Energy Balance (SSEBop) model for quantifying and mapping evapotranspiration. Applied Engineering in Agriculture, 34(3), 555-566. https://elibrary.asabe.org/abstract.asp?AID=48975&t=3&dabs=Y&redir=&redirType=
Senay, G. B., Kagone, S., & Velpuri, N. M. (2020). Operational Global Actual Evapotranspiration: Development, Evaluation and Dissemination. Sensors, 20(7), 1915. https://www.mdpi.com/1424-8220/20/7/1915
Senay, G.B., Friedrichs, M., Morton, C., Parrish, G.E., Schauer, M., Khand, K., Kagone, S., Boiko, O. and Huntington, J., 2022. Mapping actual evapotranspiration using Landsat for the conterminous United States: Google Earth Engine implementation and assessment of the SSEBop model. Remote Sensing of Environment, 275, p.113011. https://doi.org/10.1016/j.rse.2022.113011
Senay, G.B., Parrish, G.E., Schauer, M., Friedrichs, M., Khand, K., Boiko, O., Kagone, S., Dittmeier, R., Arab, S. and Ji, L., 2023. Improving the Operational Simplified Surface Energy Balance Evapotranspiration Model Using the Forcing and Normalizing Operation. Remote Sensing,15(1), p.260. https://doi.org/10.1111/1752-1688.12956


