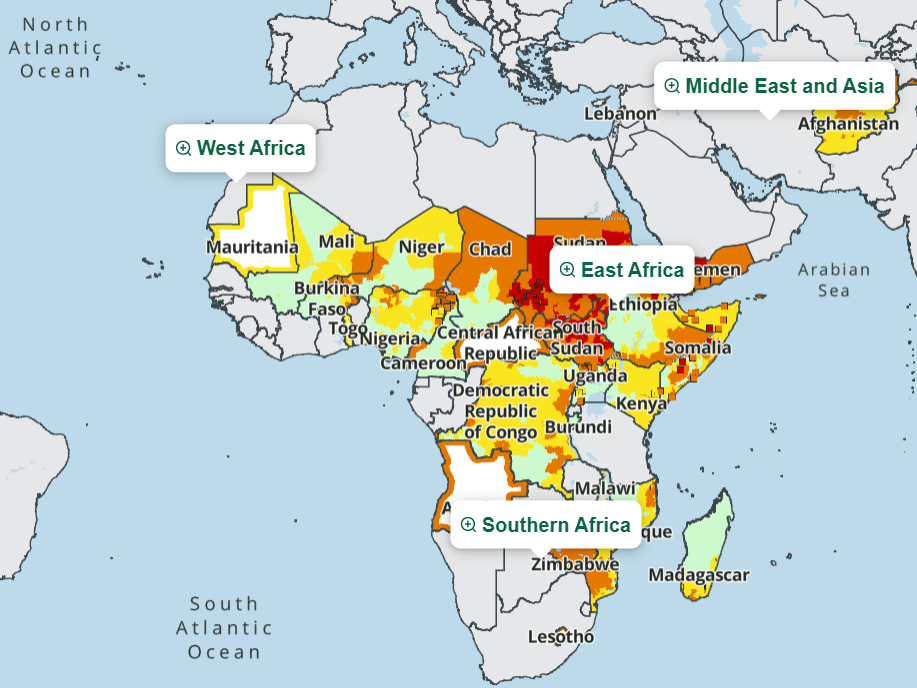
CHIRPS Seasonal Rainfall Accumulation - Mar-May
- Home
- »
- Search
- »
- Africa
- »
- East Africa
- »
Data Sets
Disclaimer: Due to the limited number of station inputs, the preliminary (prelim) CHIRPS data are considered provisional until that time when the full complement of station inputs can be incorporated (approximately 20 days after the end of the month).
Pentadal Period
East Africa
Loading subregion products...
Product Seasonal Calendar
Product Documentation
|
(CHIRPS) |
|
Background The Famine Early Warning Systems Network (FEWS NET) uses satellite rainfall estimates as inputs for monitoring agricultural food production. This information is used to evaluate food security conditions in different parts of the world. By combining high resolution (0.05°) rainfall mean fields with current satellite-derived rainfall estimates, the Climate Hazards Group InfraRed Precipitation with Stations (CHIRPS) estimates provide daily, pentadal* (5-day), dekadal (10-day), and monthly precipitation fields suitable for crop monitoring. As of December 6, 2024, version 3.0 of CHIRPS is complete and available to the public and it replaces CHIRPS 2.0. More information about CHIRPS 3.0 can be found here. Data Inputs to CHIRPS The main data sources used in the creation of CHIRPS are: (1) the monthly precipitation climatology, CHPClim2, temporally disaggregated at each grid cell location into 72 pentadal long-term average accumulation values, in millimeters—these 72 mean values describe the expected annual sequence of rainfall at each location; (2) geostationary thermal infrared (IR) satellite observations from two NOAA sources, the Climate Prediction Center IR product (0.5 hour temporal resolution, 4 km spatial resolution, for 2000–present) and the National Climatic Data Center IR product (3 hour temporal resolution, 8 km spatial resolution, for 1981–2008) (Janowiak and others, 2001; Knapp and others, 2011); (3) the Tropical Rainfall Measuring Mission (TRMM) 3B42 product from NASA (Huffman and others, 2007; Huffman and others, 2011); (4) atmospheric model rainfall fields from the NOAA Climate Forecast System, version 2 (CFSv2) (Saha and others, 2010; Environmental Modeling Center, 2011); and (5) in situ precipitation observations obtained from a variety of sources including national and regional meteorological services. All the data sources were compiled as 5-day rainfall accumulations. The pentad is the focus of the CHIRPS estimation process because sub-monthly time steps are needed for monitoring and modeling agricultural drought (Verdin and Klaver, 2002; Funk and others, 2014). The CHIRPS Procedure CHIRPS is the product of a two-part process. First, IR Precipitation (IRP) pentad rainfall estimates are created from satellite data by calculating the percentage of time during the pentad that the IR observations indicate cold cloud tops (<235° K) and converting that value into millimeters of precipitation by means of previously determined local regression with TRMM 3B42 precipitation pentads. The IRP pentads are then expressed as percent of normal by dividing the values by their long-term (1981–2012) IRP means. These unitless values represent variations in time from the long-term mean (below normal, normal, or above normal). The percent of normal IRP pentad is then multiplied by the corresponding CHPClim2 pentad to produce an unbiased gridded estimate, with units of millimeters per pentad, called the Climate Hazards Group IR Precipitation (CHIRP). In the second part of the process, an extensive collection of rainfall stations is blended with the CHIRP data to produce the final product, CHIRPS. The IRP estimate represents the temporal component of the rainfall accumulated during a pentad, while the CHPClim2 represents the spatial component. This approach has been determined to effectively represent some of the systematic climate effects of complex terrain (Funk and others, 2007). In some cases, there are missing IRP values due to incomplete satellite coverage. These data gaps, which primarily occurred during the 1980s, were filled in using CFSv2 data. The CFSv2 estimates were bias corrected in the same way as the IRP estimates, by using the ratio of CHPClim2 pentad to the long-term pentadal mean of the CFSv2 (Funk and others, 2014). CHIRPS Availability Two CHIRPS products are produced operationally: a rapid preliminary version, and a subsequent final version. The preliminary CHIRPS product is available, for the entire domain, soon after the end of a pentad. The preliminary CHIRPS version incorporates only those GTS station data that are available within a 1-day delay. Other station datasets, e.g., from the Global Historical Climatology Network and the Global Summary of the Day, take up to approximately 20 days after the end of the month to completely report data for all stations. These data are used to produce the final CHIRPS version, which is available shortly after the 20th of the following month. Final monthly, rescaled pentads, and rescaled daily products are calculated at that time (Funk and others, 2014). Disclaimer Due to the limited number of station inputs, the preliminary (prelim) CHIRPS data are considered provisional until that time when the full complement of station inputs can be incorporated (approximately 20 days after the end of the month). Coordinate System Description Spatial Reference: GCS_WGS_1984 Units: DD (decimal degrees) Datum: D_WGS_1984 Spatial Domain: 60°S to 60°N latitude, 180°W to 180°E longitude Pixel size: x-direction: 0.05°; y-direction: 0.05° NoData value: -9999.0 References Environmental Modeling Center/National Center for Environmental Prediction/National Weather Service/NOAA/U.S. Department of Commerce, 2011, updated daily. NCEP Climate Forecast System Version 2 (CFSv2) 6-hourly Products. Research Data Archived at the National Center for Atmospheric Research, Computation and Information Systems laboratory, accessed January 11, 2014, at http://rda.ucar.edu/datasets/ds094.0 . Funk, C., Husak, G., Michaelsen, J., Love, T., and Pedreros, D., 2007, Third generation rainfall climatologies—Satellite rainfall and topography provide a basis for smart interpolation, in Crop and Rangeland Monitoring Workshop, 2nd, Nairobi, Kenya, March 2007, Extended Abstract. Funk, C.C., Peterson, P.J., Landsfeld, M.F., Pedreros, D.H., Verdin, J.P., Rowland, J.D., Romero, B.E., Husak, G.J., Michaelsen, J.C., and Verdin, A.P., 2014, A quasi-global precipitation time series for drought monitoring: U.S. Geological Survey Data Series 832, 4 p., available only online at http://dx.doi.org/10.3133/ds832. Huffman, G.J., Bolvin, D.T., Nelkin, E.J., Wolff, D.B., Adler, R.F., Gu, G., and Stocker, E.F., 2007, The TRMM multisatellite precipitation analysis (TMPA)—Quasi-global, multi-year, combined-sensor precipitation estimates at fine scales: Journal of Hydrometeorology, v. 8, no.1, p. 38–55. Huffman, G.J., Adler, R.F., Bolvin, D.T., and Nelkin, E.J., 2011, The TRMM multi-satellite precipitation analysis (TMPA), in Mekonnen Gebremichael, Faisal Hossain, Satellite rainfall applications for surface hydrology: Netherlands, Springer, p. 3–22. Janowiak, J.E., Joyce, R.J., and Yarosh, Y., 2001, A real-time global half-hourly pixel-resolution infrared dataset and its applications: Bulletin of the American Meteorological Society, v. 82, no. 2, p. 205–217. Knapp, K.R., Ansari, S., Bain, L., Bourassa, M.A., Dickinson, M.J., Funk, C., Helms, C.N., Hennon, C.C., Holmes, C., Huffman, G.J., Kossin, J.P., Lee, H-Tien, Loew, A., and Magnusdottir, G., 2011, Globally gridded satellite (GriSat) observations for climate studies: Bulletin of the American Meteorological Society, v. 92, no. 7, p. 893–907. Saha, S., Moorthi, S., Pan, H. L., Wu, X., Wang, J., Nadiga, S., and Reynolds, R. W. 2010, The NCEP climate forecast system reanalysis. Bulletin of the American Meteorological Society, 91(8), p. 1015–1057. Verdin, J.P., and Klaver, R.W., 2002, Grid-cell-based crop water accounting for the famine early warning system: Hydrological Processes, v. 16, no. 8, p. 1617-1630. (Also available online at http://dx.doi.org/10.1002/hyp.1025.) * pentadal A pentad is a group of 5. We use pentadal to define a group of calendar days - generally 5 days. However, because we confine the calendar year to 72 pentads, and each month to 6 pentads, there are not always 5 days in a pentad. The first 5 pentads of each month have 5 days. The last pentad, or 6th pentad, of each month can have as few as 3 days (for example, Feb with 28 days in non-leap years) and as many as 6 days (Jan, Mar, May, Jul, Aug, Oct, Dec, with 31 days). Because of a one-day lag in data reception and processing, WRSI and derivative products are updated on the 2nd, 7th, 12th, 17th, 22nd, and 27th of each month. |
Related FEWS NET Services
The Famine Early Warning Systems Network (FEWS NET) is a leading provider of early warning and analysis on acute food insecurity around the world. Explore our other services at the following: