NDVI eVIIRS
- Home
- »
- Search
- »
- Africa
- »
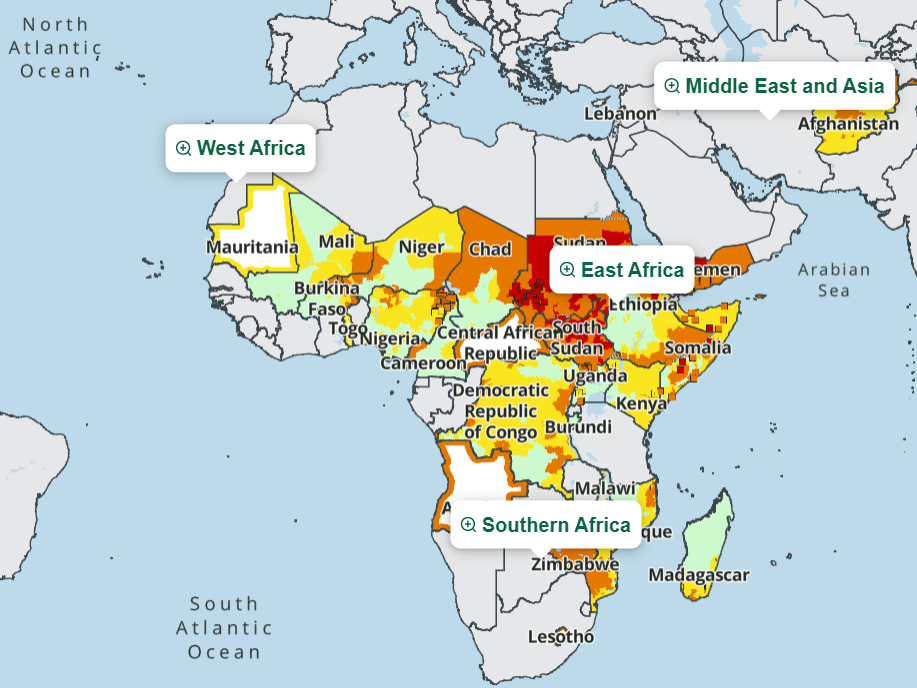
- East Africa
- »
Data Sets
Pentadal Period
East Africa
Loading subregion products...
Download
Product Documentation
eVIIRS Normalized Difference Vegetation Index (NDVI)
(Document created on 04/08/2022)
Background
The U.S. Geological Survey (USGS) Earth Resources Observation and Science (EROS) Center distributes satellite-derived vegetation products generated from the expedited (or EROS) Visible Infrared Imaging Radiometer Suite (eVIIRS) collection. This collection is based on the Suomi National Polar-orbiting Partnership (S-NPP) Visible Infrared Imaging Radiometer Suite (VIIRS) data acquired by the NPP, which is the result of a partnership between the National Aeronautics and Space Administration (NASA) and the National Oceanic and Atmospheric Administration (NOAA). These products respond to operational land monitoring applications requiring near-real time Normalized Difference Vegetation Index (NDVI) data for comparison against historical records. Real-time and historical NDVI products are composited in 10-day (dekadal) intervals on a Geographic-mapping grid.
Data
We use eVIIRS 10-day maximum-value composite NDVI images at 375m spatial resolution to monitor vegetation conditions throughout major food insecure areas of the world. Note that the 10-day composites are updated on a pentadal (5-day) time step, resulting in 72 composite periods per year. NDVI, a measure of the density of chlorophyll contained in vegetative cover, is defined as (NIR - RED) / (NIR + RED), where NIR is the near-infrared reflectance and RED is the visible-red reflectance. We generate these vegetation products from eVIIRS surface reflectance, corrected for molecular scattering, ozone absorption, and aerosols using VIIRS Science Team algorithms.
The NDVI and anomaly maps are the product of a temporally smoothed 375m NDVI dataset. We apply a time series smoother algorithm, developed by Swets et al. (1999), to smooth NDVI composites for the years 2012 to present using the USGS Denali supercomputer. The smoother technique uses a weighted least squares linear regression approach to "correct" observations that are of poor quality due to clouds or other atmospheric contamination. We derived a 10-year mean NDVI on a pixel-by-pixel basis for each of 72 composite periods per year. As current-year composites become available, they are added to the time series and smoothed, resulting in a smoothed composite comparable to the historical mean or a given 10-day period.
While temporal smoothing can be effective at improving time series data, it can be problematic to implement in real time for areas of persistent cloud cover. Therefore, we've implemented a process that steps back in the time series and replaces data after six composite periods, allowing cloud-free smoothed data to have been obtained. Prior to the final corrected data being available, interim graphics for all products include masks using cloud flags from the original input data.
Image Products
- Temporally Smoothed NDVI - Smoothed 10-day NDVI composite.
- Mean Anomaly - Anomalies represent a subtraction of the mean NDVI values (2012-2021) for a 10-day period from current-year values for the same period, rendering an image where negative values portray less vigorous vegetation than average, and positive values represent areas that are more vigorous in the current year.
- Previous Year Difference - The difference image is a subtraction of the current year NDVI values from those of the previous year.
- Percent of Mean - The percent of normal uses the 2012-2021 mean to compare the current composite relative to average conditions and expresses that anomaly as a percent.
Spatial Parameters for eVIIRS Data
eVIIRS NDVI data are stretched (mapped) linearly (to byte values) as follows:
[-1.0, 1.0] -> [0, 200] - Invalid Values: 201 - 255
NDVI = (value - 100) / 100; example: [(150 - 100) / 100 = 0.5 NDVI]
Anomaly / Difference Classification:
The absolute difference and anomaly image is mapped from -0.3 to 0.3 NDVI. The area of relatively no difference is approximately -0.05 - 0.05.
Percent of Mean:
Expressed as percent, the percent of mean data include values between 95 and 105 indicating average conditions. Values below 95 represent below average vegetation conditions, while those above 105 represent above average conditions.
All data are in GeoTIFF format with embedded color tables.
COORDINATE SYSTEM DESCRIPTION:
Geographic
Units: DD (decimal degrees)
Spheroid: WGS84
Pixel size:
x-direction: 0.003619 (deg)
y-direction: 0.003619 (deg)
References:
USGS EROS Archive - Vegetation Monitoring - EROS Visible Infrared Imaging Radiometer Suite (eVIIRS), https://www.usgs.gov/centers/eros/science/usgs-eros-archive-vegetation-monitoring-eros-visible-infrared-imaging
Swets, D.L., Reed, B.C., Rowland, J.D. & Marko, S.E. (1999). A weighted least-squares approach to temporal NDVI smoothing. In: 1999 ASPRS Annual Conference: From Image to Information, Portland, Oregon, May 17-21. Proceedings: Bethesda, Maryland, American Society for Photogrammetry and Remote Sensing.
USGS Advanced Research Computing, USGS Denali Supercomputer: U.S. Geological Survey, https://doi.org/10.5066/P9PSW367
Related FEWS NET Services
The Famine Early Warning Systems Network (FEWS NET) is a leading provider of early warning and analysis on acute food insecurity around the world. Explore our other services at the following: