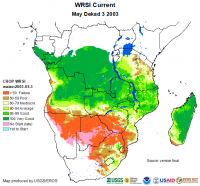
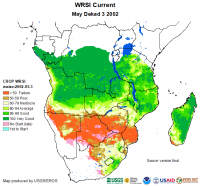
CHIRPS - Croplands WRSI
Southern Africa -- Historical End of Season Graphics
Product Seasonal Calendar
Product Documentation
|
(updated: February 2025) The spatially explicit water requirement satisfaction index (WRSI1) is an indicator of crop performance based on the availability of water to the crop during a growing season. FAO studies have shown that WRSI can be related to crop production using a linear yield-reduction function specific to a crop (FAO, 1977; FAO, 1979; FAO, 1986). Additionally, Verdin and Klaver (2002) and Senay and Verdin (2001) demonstrated a regional implementation of WRSI in a grid cell-based modeling environment. WRSI for a season is based on the water supply and demand a crop experiences during a growing season. It is calculated as the ratio of seasonal actual evapotranspiration (AET) to the seasonal crop water requirement (WR):
                         AET
          WRSI =  ---------------  * 100
                         WR
WR is calculated from the potential evapotranspiration (PET) using the crop coefficient (Kc) to adjust for the
growth stage of the crop.
WR = PET * KC
AET represents the actual (as opposed to the potential) amount of water withdrawn from the soil water reservoir
('bucket'). Whenever the soil water content is above the maximum allowable depletion (MAD) level (based on crop
type), the AET will remain the same as WR, i.e., no water stress. But when the soil water level is below the MAD
level, the AET will be lower than WR in proportion to the remaining soil water content (Senay and Verdin, 2003).
The soil water content is obtained through a simple water balance equation where the level of soil water is monitored in a bucket defined by the water holding capacity (WHC) of the soil and the crop root depth, i.e.,
SWi = SWi-1 + PPTi - AETi
where SW is soil water content, PPT is precipitation, and subscript i is the time step index.
WRSI calculation requires a start-of-season (SOS) and end-of-season time (EOS) for each modeling grid-cell. Maps of these two variables are particularly useful in defining the spatial variation of the timing of the growing season and, consequently, the crop coefficient function, which defines the crop water use pattern of crops. The model determines the SOS using onset-of-rains based on simple precipitation accounting. The onset-of-rains is determined using a threshold amount and distribution of rainfall received in three consecutive dekads. SOS is established when there is at least 25 mm of rainfall in one dekad followed by a total of at least 20 mm of rainfall in the next two consecutive decades. The length of growing period (LGP) for each pixel is determined by the persistence, on average, above a threshold value of a climatological ratio between rainfall and potential evapotranspiration. Thus, EOS was obtained by adding LGP to the SOS dekad for each grid cell. The WRSI model is capable of simulating different crop types whose seasonal water use pattern has been published in the form of a crop coefficient. Such crops include maize (corn), sorghum, millet, wheat, etc. At the end of the crop growth cycle, or up to a certain dekad in the cycle, the sum of total AET and total WR are used to calculate WRSI in a Geographic Information System (GIS) environment at 0.1 degree (about 10 km) spatial resolution. A case of 'no deficit' will result in a WRSI value of 100, which corresponds to the absence of yield reduction related to water deficit. A seasonal WRSI value less than 50 is regarded as a crop failure condition (Smith, 1992). Yield reduction estimates based on WRSI contribute to food security preparedness and planning. As a monitoring tool, the crop performance indicator can be assessed at the end of every 10-day period during the growing season. As an early warning tool, end-of-season crop performance can be estimated using long-term average meteorological data. Due to the difference in the growing season, WRSI maps are generated and distributed on a region-by-region basis (e.g., the Sahel, Southern Africa, Greater Horn of Africa regions). At the end of every dekad, two image products associated with the WRSI are produced and disseminated for the FEWS NET activity. The following paragraphs provide a brief description of these products. Inputs The most important inputs to the model are precipitation and potential evapotranspiration (PET). USGS FEWS NET currently processes daily PET and precipitation data combinations from different sources, including:
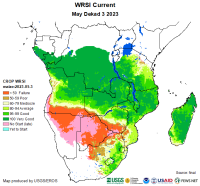
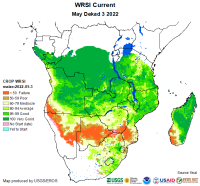
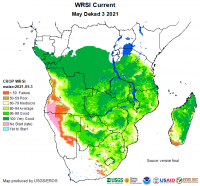
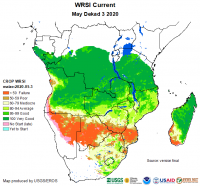
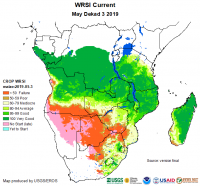
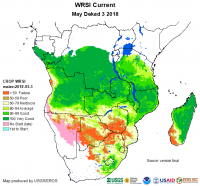
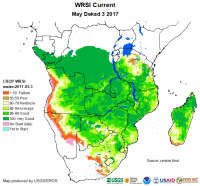
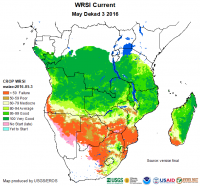
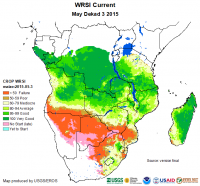
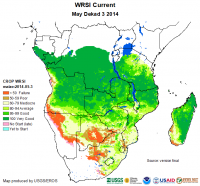
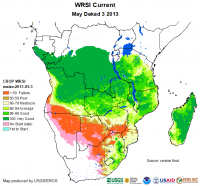
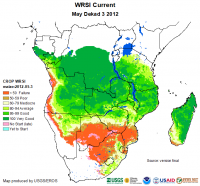
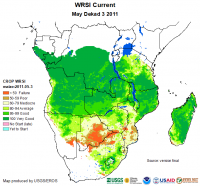
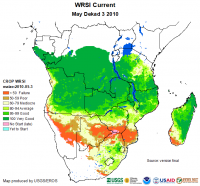
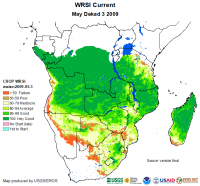
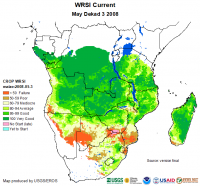
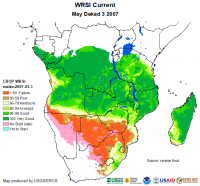
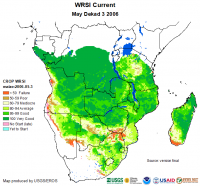
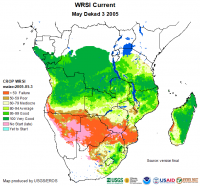
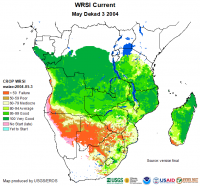
In addition to the inputs above, the WRSI model uses relevant soil information from the FAO (1988) digital soils map and topographical parameters derived from Digital Elevation Model (DEM) data (HYDRO-1K, Gesch et al., 1999). Brief Description of current and extended WRSI products 1. Current WRSI This map portrays WRSI values for a particular crop from the start of the growing season until this time period. It is based on the actual estimates of meteorological data to-date. For example, if the cumulative crop water requirement up to this period was 200 mm and only 180 mm was supplied in the form of rainfall, the crop experienced a deficit of 20 mm during the period and thus the WRSI value will be ((180 / 200) * 100 = 90). This approach is slightly different from the traditional FAO update where the cumulative supply-to-date is compared to the seasonal crop water requirement, instead of the requirement up to the current period. Note that, unlike the FAO update, the current WRSI can increase in value in the later part of the growing season if the demand (crop water requirement) and supply (rainfall) relationship becomes favorable. However, both the FAO and this approach are mathematically equivalent when the end-of-season dekad becomes the current dekad. 2. Extended WRSI This is a forecast estimate of WRSI at the end of the growing season. Long-term average climatological data are used to calculate WRSI for the period between the current dekad and the end-of-season. The calculation principles are the same as the 'Current WRSI'. This is also a deficit-based estimate of WRSI. The long-term average CHIRPS and ETos data are based on 1991-2020 (30-year mean). Note that at the end of the growing season, only current-year CHIRPS and ETos are used as input, and “Current WRSI” is the same as “Extended WRSI”. Water Requirement Satisfaction Index Anomaly Products There are two WRSI anomaly images: 'Pct Median' and 'Pct Previous Year' 1. Pct Median: WRSI anomaly map shows the relative magnitude of the WRSI as a percentage of the median WRSI: WRSI Pct Median (%) = (Extended WRSI * 100 / Median EOS WRSI) where 'Median EOS WRSI' is the end-of-season WRSI generated using median rainfall and ETos from 1991-2020. Pct Previous Year: WRSI anomaly uses the previous year end-of-season WRSI instead of the median WRSI. 2. Pct Previous Year: WRSI anomaly uses the previous year end-of-season WRSI instead of the median WRSI. WRSI Pct Previous Year (%) = (Extended WRSI * 100 / Previous Year WRSI) where 'Previous Year WRSI ' is the previous year end-of-season WRSI. Although site/region specific validation is important, the user may use these anomaly maps as a semi-quantitative indicator for the performance of the crops in relation to the average condition. For example, a value close to 100 signifies that this year's crop performance is about same compared to the median or last year, while percentage above and below 100 may indicate above and below the median or last year's production forecasts, respectively. Links to rasters zip product: Raster zip products available since 2001 for in-year (e.g. Mar-Sep) seasons and 2001-2002 for cross year seasons (e.g. Oct-Feb) until present. The zip product naming convention is wYYYYDDCC.zip where YYYY is the 4-digit year, DD is the 2-digit dekad of the year (1-36), and CC is the WRSI region code. In addition to the raster files in the zip product, it contains documentation (W_images.pdf) and colomarp (*.clr) files.
References: FFAO, 1977. Crop water requirements. FAO Irrigation and Drainage Paper No. 24, by Doorenbos J and W.O. Pruitt. FAO, Rome, Italy. FAO, 1979. Agrometeorological crop monitoring and forecasting. FAO Plant Production and Protection paper No. 17, by M. Frère and G.F. Popov. FAO, Rome, Italy. FAO, 1986. Early Agrometeorological crop yield forecasting. FAO Plant Production and Protection paper No. 73, by M. Frère and G.F. Popov. FAO, Rome, Italy. Gesch, D.B., K.L. Verdin and S.K. Greenlee, 1999. New land surface digital elevation model covers the Earth. EOS, Transactions of the American Geophysical Union, v. 80, n. 6, pp. 69-70. Senay, G.B. and J. Verdin, 2001. Using a GIS-Based Water Balance Model to Assess Regional Crop Performance. Proceedings of the Fifth International Workshop on Application of Remote Sensing in Hydrology, October 2-5, 2001, Montpellier, France. Senay, G.B. and J. Verdin, 2003. Characterization of Yield Reduction in Ethiopia Using a GIS-Based Crop Water Balance Model. Canadian Journal of Remote Sensing, vol. 29, no. 6, pp. 687-692. Shuttleworth, J., 1992. Evaporation. Handbook of Hydrology, Maidment, D. (ed.). McGraw-Hill: New York; 4.1-4.53. Smith, M., 1992. Expert consultation on revision of FAO methodologies for crop water requirements. FAO, Rome, Publication 73. Verdin, J. and R. Klaver, 2002. Grid cell-based crop water accounting for the famine early warning system. Hydrological Processes, 16:1617-1630. Xie, P. and P.A. Arkin, 1997. A 17-year monthly analysis based on gauge observations, satellite estimates, and numerical model outputs. Bulletin of the American Meteorological Society 78(11): 2539-58. NOAA ETos (Hobbins): https://psl.noaa.gov/eddi/globalrefet/ Footnotes 1 Originally developed by FAO, the WRSI has been adapted and extended by USGS in a geospatial application to support FEWS NET monitoring requirements. 2 A pentad is a group of 5. We use pentad to define a group of calendar days - generally 5 days. However, because we confine the calendar year to 72 pentads, and each month to 6 pentads, there are not always 5 days in a pentad. The first 5 pentads of each month have 5 days. The last pentad, or 6th pentad, of each month can have as few as 3 days (for example, Feb with 28 days in non-leap years) and as many as 6 days (Jan, Mar, May, Jul, Aug, Oct, Dec, with 31 days). Because of a one-day lag in data reception and processing, WRSI and derivative products are updated on the 2nd, 7th, 12th, 17th, 22nd, and 27th of each month. |


